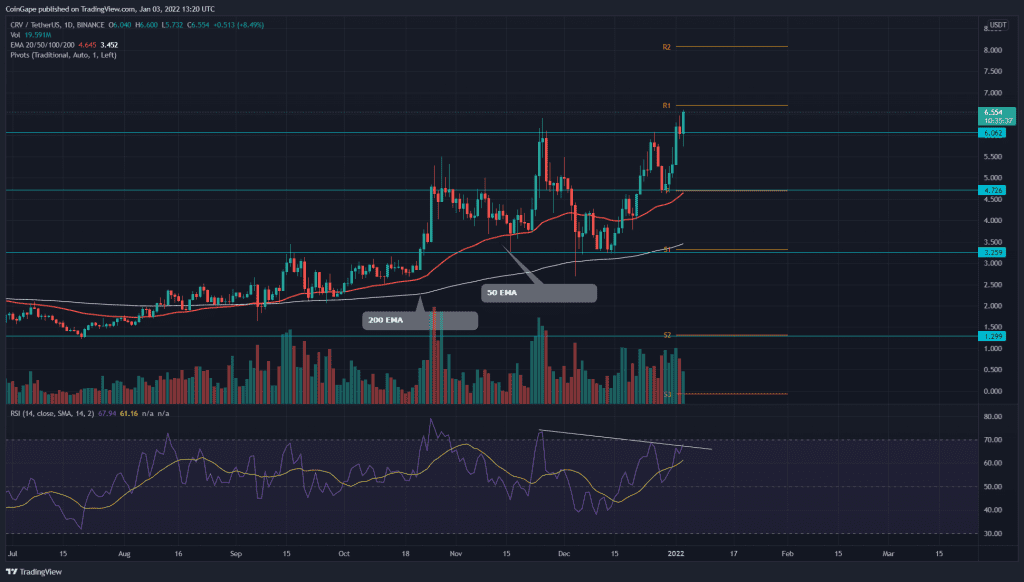
The CRV token initiated its recovery rally from mid-December 2021. The token started to rally again and eventually gave birth to the cup and handle pattern. Recently the price has managed to breach the neckline for this bullish, indicating the token is ready to test the higher levels.
Curve DAO Key technical points:
- The daily RSI line displays minor bearish divergence
- The 24-hour trading volume in the Curve Dao token is $915.5 Million, indicating a 13.3% loss.
Source-Tradingview
Previously when we covered an article on Curve Dao token on December 23rd, the technical chart indicated the rising underlying bullishness in this token as it was preparing to knock out another significant resistance of $5.
The token price gave a daily candle closing above the resistance level and continued its rally to the previous higher high of $6. However, before surpassing the psychological level, the pair had to attend a minor pullback, which found demand near $4.7.
The crucial EMAs(20, 50, 100, and 200) have again aligned in favor of bulls. These EMA levels can act as potential support during the occasional corrections.
The daily Relative Strength Index (66) supports a bullish sentiment regarding this token. However, a slight bearish divergence in its chart gives more reason to be cautious.
Traditional Pivot Level Hints Possible Supply Level For CRV Token

This lower time frame chart simplifies this whole correction and recovery act by displaying a cup and handle pattern. On January 1st, the CRV price gave a decisive breakout from the same $6 neckline resistance indicating even more potential for the token.
The pair performed one day retest to check for sufficient demand, and today with a strong follow-up candle, it is trading at the $6.4 mark, with an intraday gain of 6.3%.
The traditional pivot levels showed great confluence with the known levels of the price action. The crypto can use this indicator to get a slight hint for the possible resistance levels above.
The traditional pivot level suggest;
Resistance- $6.7(R1), $8.1(R2)
Support- $4.7(P), $3.31(S1)


