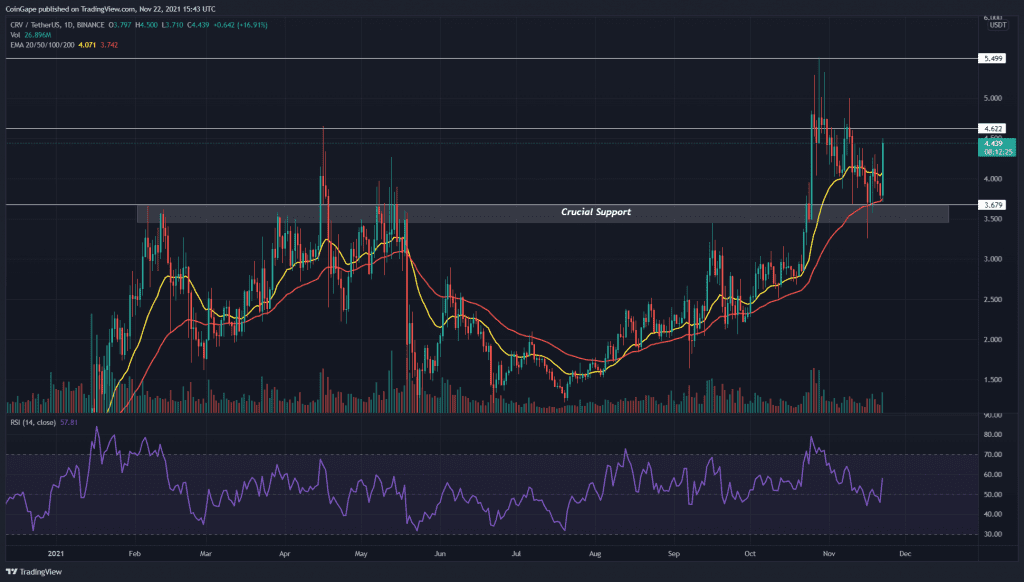
The technical chart of the CRV token indicates an overall uptrend. The token has recently been through a retracement phase, and its price is experiencing decent support from the $3.68 support. The price is currently trying to break out from a bullish in the 4-hour time frame, and its completion should act as great confirmation for a bull rally.
Key technical points:
- The CRV token price obtains strong support from the 50-day EMA line
- The CRV token daily chart shows a striking dip in the RSI value
- The intraday trading volume in the CRV token is $577 Million, indicating a 144% gain
Source- CRV/USD chart by Tradingview
The CRV token indicated a remarkable rally in its chart, which made a high of $5.5 mark. The token price was rejected from this new swing high, resulting in a minor correction phase. The CRV price plunged to the crucial chart level of $3.6 to obtain proper support from this level.
As for today, this token displays some buying pressure at this level by forming a bullish engulfing candle. This huge green candle has swollen almost two weeks of trading activity, indicating an intraday gain of 17.3%.
The Relative Strength Index value at 57 sustains a bullish sentiment for this token. However, for this minor pullback, the RSI value has dropped more than what’s expected, indicating weakness in this rally.
CRV/USD Chart In The 4-hour Time Frame

Source- CRV/USD chart by Tradingview
During the retrenchment phase, the CRV token resonated in a falling parallel channel pattern. The token price is currently trying to breach the overhead resistance trendline, which should provide an excellent entry opportunity for crypto traders if the price sustains this breakout.
The MACD indicators show its both the MACD and signal line are on the verge of crossing above the neutral zone, providing a great confirmation for market buyers.
.


