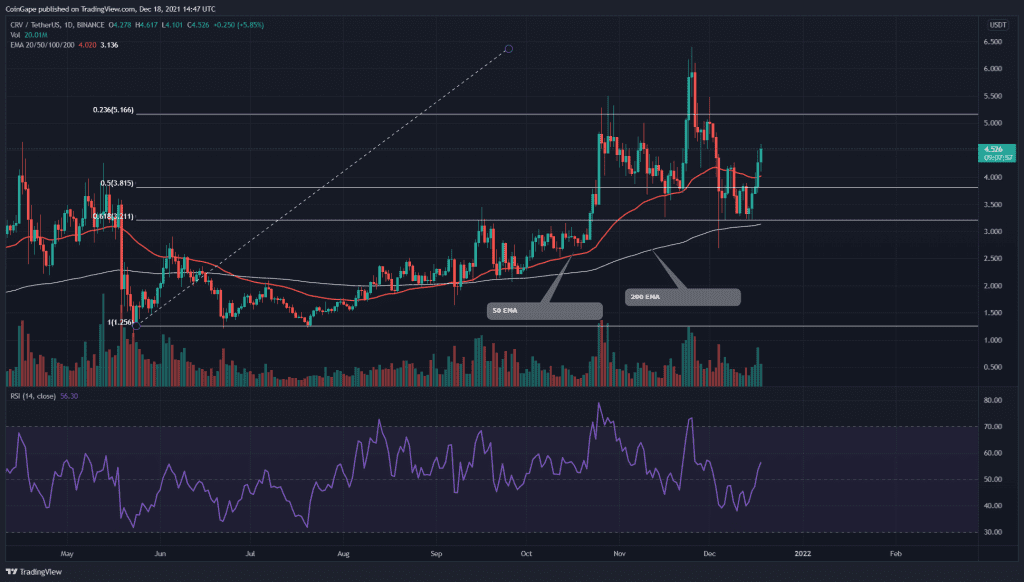
The technical chart for CRV token illustrates a slow but steady rise in its price. The recent retracement caused the price to fall by 50% in value, which lowered its price by a significant amount to $3.2 support. Attained enough support from this mark, the price has begun a recovery phase in the expectation of sustaining this upward trend.
Key technical points:
- The CRV token chart shows a bullish crossover of the 20-and-50 day EMA
- The current price for this token is $4.49, with a 24-hour gain of 5.12% gain
- The intraday trading volume in the CRV token is $7.56 Billion, indicating a 33.6% gain.
Source- CRV/USD chart by Tradingview
The last time when we covered an article on CRV/USD, the token price bounced from the $3.2 support and marked a new swing high to $6.39. However, the price couldn’t sustain this level and was immediately dropped back to the same bottom support coinciding with the Fibonacci retracement level.
This time the coin took nearly two weeks to stabilize its price above the $3.2 mark, and on December 15th, it provided a morning star candle pattern initiating a bullish reversal. So far, the coin shows five consecutive green candles offering a recovery gain of 43%.
The CRV price has reclaimed the 20 and 50 EMA, maintaining its bullish alignment among the crucial EMAs (20, 50, 100, and 200). Moreover, The Relative Strength Index (57) line has crossed above the neutral zone signaling a bullish sentiment in the price.
CRV/USD 4hr time frame chart

Source- CRV/USD chart by Tradingview
As for today, the CRV token price has managed to breach the overhead resistance zone of $4.4-$4.2, with significant support from trading volume. Sustaining above this breakout, the token would be one step closer to continuing this rally, also providing traders with a great long entry opportunity.
The traditional pivot shows remarkable confluence with the CRV token chart levels. As per these pivot levels, these traders can expect the nearest resistance at $4.85, followed by $5.4. On the opposite side, the support levels include $4.3 and $3.7.


