Data shows the Bitcoin fund flow ratio has been going down in the last couple of years, suggesting that whales have started to prefer selling through OTC deals over centralized exchanges.
Bitcoin Fund Flow Ratio Reaches Lowest Level Since 2015
As explained by an analyst in a CryptoQuant post, BTC whales seem to have increasingly been trading outside exchanges in recent times.
The “fund flow ratio” is an indicator that’s defined as the the total Bitcoin amount entering or exiting centralized exchanges divided by the total amount of coins involved in trading on the entire network.
In simpler terms, this metric tells us what part of the total transactions on the network involve the usage of exchanges.
When the value of this indicator is high, it means investors are heavily using exchanges right now as a significant portion of the daily transactions are happening on exchanges.
Related Reading | Data Shows Bitcoin Selling On Binance Has Been Weakening Recently
On the other hand, low values of the ratio imply exchange activity is low at the moment. Such a trend suggests investors are currently preferring to trade through OTC deals.
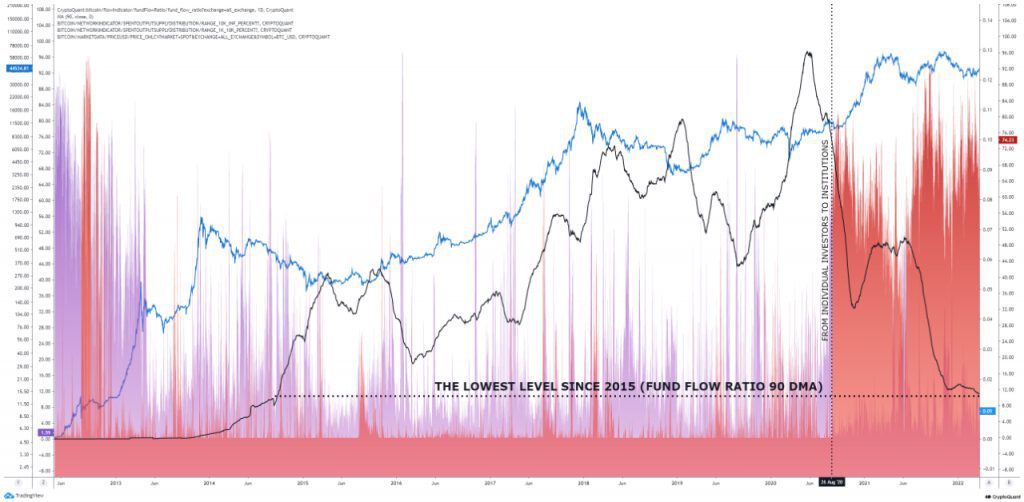
Now, here is a chart that shows the trend in the Bitcoin fund flow ratio (90DMA) over the last several years:
Looks like the value of the indicator has declined recently | Source: CryptoQuant
As you can see in the above graph, the Bitcoin fund flow ratio was at a high just before the 2021 bull run kicked off.
However, soon after that the indicator’s value started sharply dropping off. The decline has slowed down a bit recently, but it hasn’t stopped. As a result, the value of the ratio is now at a low not seen since 2015.
Related Reading | Robinhood Adds SHIB, SOL, COMP, And MATIC To Crypto Trading
The quant has also included data from two other indicators in the chart, the purple lines track coin movement from investors holding coins between 1k to 10k, while the red lines follow whales with more than 10k Bitcoin.
It looks like whales have been very active since August 2020, which coincides with the declining fund flow ratio. This suggests that much of these movements by the whales have been off exchanges.
So, it seems like these humongous Bitcoin holders have increasingly preferred using OTC deals in the past couple of years.
BTC Price
At the time of writing, Bitcoin’s price floats around $40.9k, down 6% in the last seven days. Over the past month, the crypto has gained 8% in value.
The below chart shows the trend in the price of the coin over the last five days.

The price of Bitcoin seems to have shown a bit of recovery over the past day | Source: BTCUSD on TradingView
Featured image from Unsplash.com, charts from TradingView.com, CryptoQuant.com


