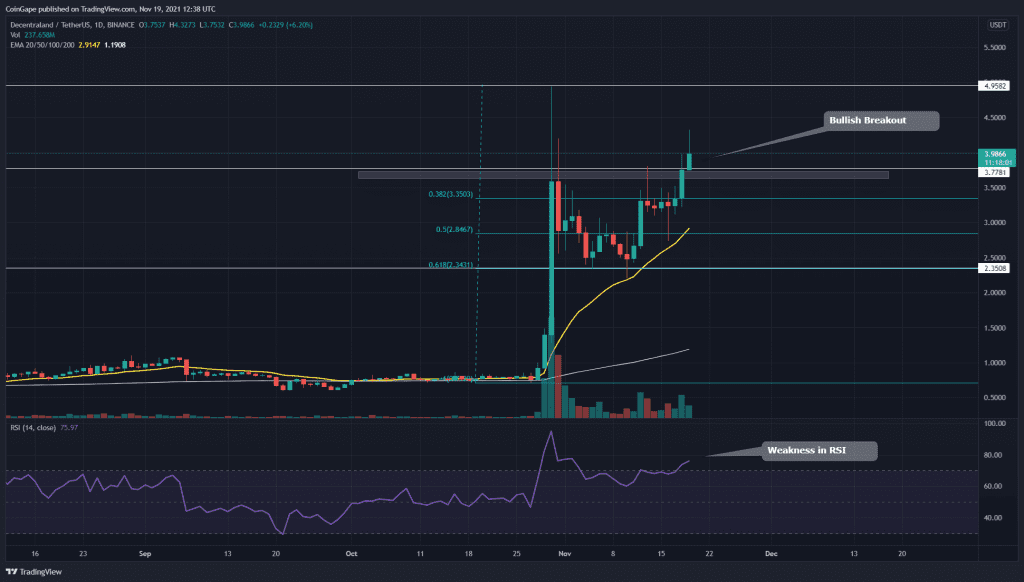
MANA token seems eager to reach the newer level of its price chart. The token showed an impressive recovery from the retracement phase, and today, it also managed to break out from the Cup and Handle pattern. Is this the right time to buy MANA?
Key technical points:
- The 20-day EMA provides good support to the MANA token price
- The daily RSI chart still indicates a considerable bearish divergence for this token
- The intraday trading volume in the MANA token is $6.79 Billion, indicating a 64.5% hike
Source- MANA/USD chart by Tradingview
After reaching the $4.95 mark, the MANA token price entered into a retracement phase. This minor pullback plunged the token to 0.618 Fibonacci retracement level, and after obtaining sufficient support from this level, the price bounce backed, suggesting the continuation of its bull rally.
In its previous rally, the MANA token gave the highest daily-candle closing around the $3.6 level, marking this area as a possible resistance level. As for today, the token price gave a breakout from this level, providing another long opportunity for crypto traders.
The Relative Strength Index(75) value suggests bullish sentiment for this token. However, the RSI shows a clear bearish divergence, which creates some doubt about this rally.
MANA/USD Chart In The 4-hour Time Frame

Source- MANA/USD chart by Tradingview
As mentioned in my previous article on MANA/USD, the token formed a Cup and Handle pattern in the 4-hour time frame chart. The pattern’s neckline was at the $3.68 mark, and today the price has provided a decisive breakout from this resistance.
The token price is currently retracing back to retest this neckline level. If the price indicated sufficient support near this level, the crypto trader can grab an excellent long entry opportunity which could provide the near target of $5 mark.
According to traditional pivot levels, the nearest resistance for this MANA price would be at $4.6, followed by $5.5. And for the support level, $3.93 and $3


