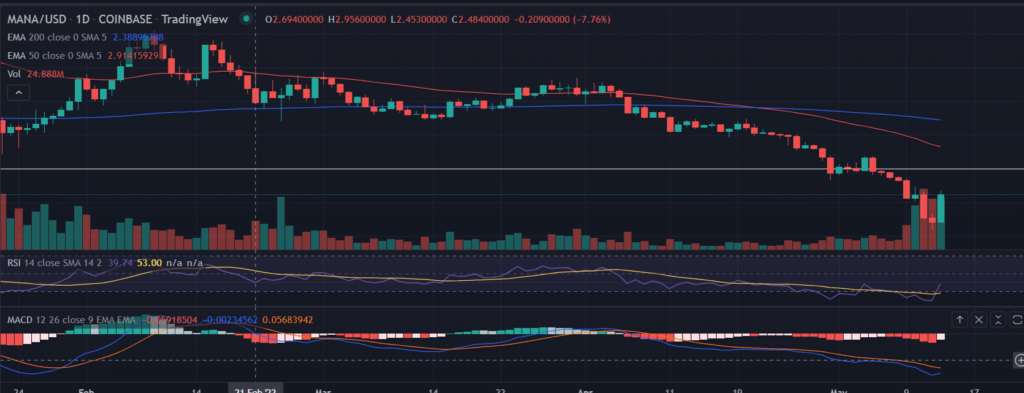
MANA price started the session on a lower note and touched the session’s high with high volume. The price is currently down 16% since the beginning of the week arising from the lows of $0.59. Investors still remain in a panic mood, the recent bounce-back could be a dead-cat bounce in the current market structure.
- MANA price hits a technical bottom below $1.0 arising quickly from the swing lows.
- A prolonged downside doesn’t seem to be exhausted as the rising volume supports the outlook.
- Further, the price is on a recovery path but faces upside resistance on the daily chart.
MANA price renews buying momentum
Let’s understand from the technical chart, where MANA price is heading from here on. The formation of a mild bullish formation, the bullish piercing candlestick pattern indicates some bounce back in the price in the oversold market structure.
The green candlesticks indicate the strong buying momentum will take out Wednesday’s high of $1.15 followed by the horizontal resistance line at $1.50.
The relative strength index (RSI) rises above the average line with a sharp spike. The positive bias indicates the continuation of the upside trend in the short term.
The moving average convergence divergence holds below the midline with increasing upside momentum.
Trending Stories
On the contrary, the fear of the downside cannot be ruled out completely. As the price remains pressured below the critical 50-day and the 200-day EMAs (Exponential Moving Average).
As of publication time, MANA/USD is trading at $1.12 up 59,12% for the day.


