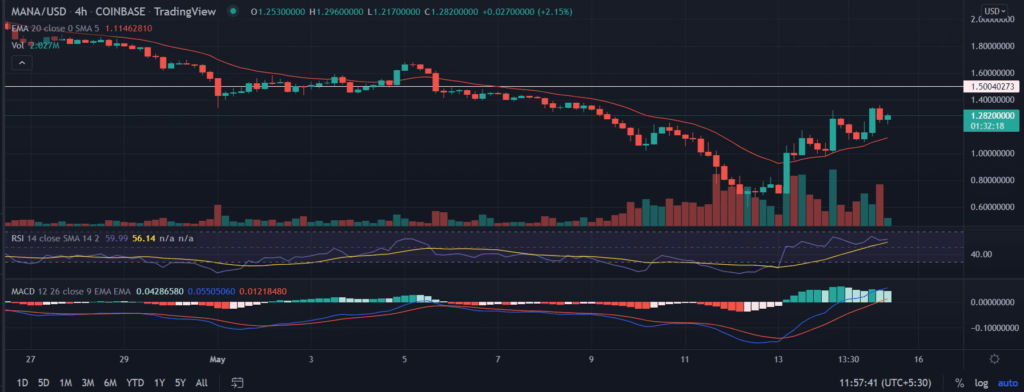
MANA price lost some ground after printing gains for two consecutive sessions. The price opened lower but managed to inch higher due to the sustained buying momentum. The rising volume backed the current price action amid the oversold market structure.
- MANA price retreats from the higher levels following two sessions’ gain.
- A bullish formation on the weekly chart suggests more upside could be stipulated.
- Oversold momentum oscillators support the probability of further gains.
Will Mana price be able to sustain the gains!
On the 4-hour chart, the price formed a bullish candlestick pattern on Thursday, a hammer technical pattern. As a result, it jumped more than 100% to trade near $1.40. In addition to that, the MANA price pierced the 20-day EMA (Exponential Moving Average) hurdle at $0.93.
Now, the price would attempt to take out the psychological $1.50 level.

On the weekly chart, MANA ran into a seventh-consecutive week of loss. However this time, it broke the long-standing support zone of $1.48 and tested the levels last seen in September 2021. But at the end of the week, the formation of ‘hammer’ indicates the correction in the price might have been over in the asset.
A weekly candlestick above $1.50 would further make up the relief rally toward $2.0.
Trending Stories
While things look positive for MANA, the downside risk remains intact for the asset. A break below $1.0 would trigger mean the dark clouds still hovering MANA. In that case, keep eye on the June 2021 low of $0.37.
As of publication time, MANA/USD trades at $1.26, down 5.40% for the day.
Technical indicators:
RSI: The relative strength index trades below the average line still off the oversold zone. Currently, it reads at 35.
MACD: The moving average convergence divergence indicates receding bearish momentum while it holds below the average line.


