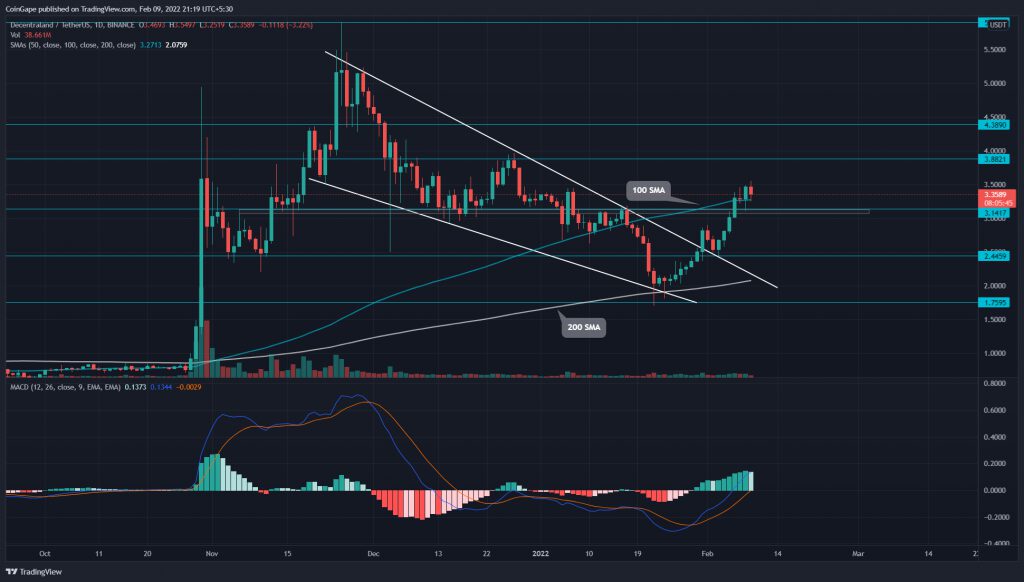
In less than three weeks the MANA/USD pair has doubled in value. The V-shaped initiate from $1.8 support has knocked several resistances and has reached its current price of $3.3. The bulls have recently reclaimed this $3 mark, and with sufficient sustainability, the metacoin should continue to march north.
Key technical points
- The 20-day SMA curving up accentuates the ongoing rally
- The daily-MACD indicators line are on the verge of crossing above the midline
- The 24-hour trading volume in the Decentraland token is $1.17 Billion, indicating a 21.5% rise.
Source- Tradingview
In the previous Decentraland (MANA) price analysis, CoinGape summarized the growth of 35% after the falling channel pattern breakout. The rally broke above the crucial mark of $3 and showed significant signals of sustenance.
However, at present, the MANA/USD chart shows the altcoin struggling to rise above the $3.45 mark, leading to a potential bearish piercing candlestick. Under the bear’s influence, the coin price may soon test the support level.
The MANA price attempts to maintain the trend above the 100-day SMA. Meanwhile, the rising 20 SMA suggests sellers are losing their grip.
The MACD indicator shows the fast and slow lines rising above the zero line mark with a rising trend in bullish histograms. Therefore, the indicator shows a solid uptrend in action.
Decentraland (MANA) Price Struggles at $3.4

Source- Tradingview
Along with the $3 breakout, the buyers have also reclaimed the 100-day SMA. If bulls sustain the $3.1 mark, it would confirm this resistance has flipped to support and plunge the altcoin to the next target at $3.88.
Contrary to the above assumption, if sellers refuse to give up on the $3.4 resistance, the coin price could violate the base support and sink to $2.5.
The technical indicates crucial resistance levels present at $3.44 and $3.88. On the opposite end, the support levels are present at $3.1 and $2.9.


