The Metaverse token like MANA gained massive popularity among the crypto investors when Facebook announced its rebranding to ‘META.’ The technical outlook for MANA/USD indicates the overall trend remains bullish, and it looks likes the token price is doing a good job sustaining on the higher levels.
Key technical points:
- The MANA token price breaks out from the Flag pattern pattern
- The intraday trading volume in the MANA token is $5.3 Billion, indicating a 318.72% hike
Source- MANA/USD chart by Tradingview
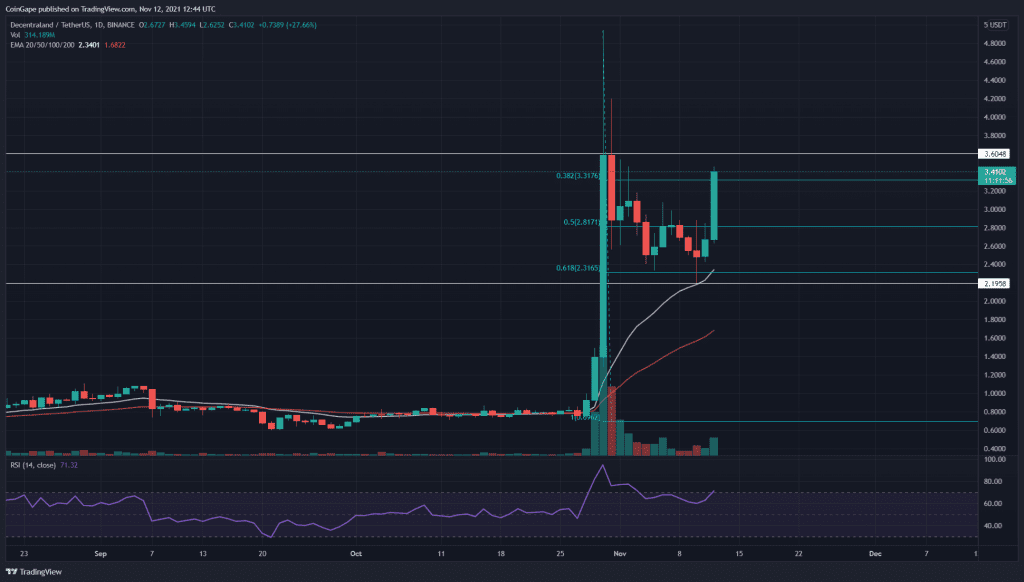
The MANA token rally made a new All-Time high of $5 on October 30th. This surge was too much for the token, and to stabilize this growth; the token provided a minor retracement phase.
The MANA price plunged to the Fibonacci level of 0.618, which provided sufficient support for the token. Furthermore, the 20 EMA line also contributed as a good support level. These crucial EMA’s validates the token is under a strong uptrend.
The Relative Strength Index(71) value has also stabilized as the sudden price surge had pushed it to the overbought territory.
MANA/USD Chart In The 4-hour Time Frame

Source- MANA/USD chart by Tradingview
The MANA token revealed a flag pattern in this lower time frame chart, providing a great long opportunity for crypto traders. On November 11th, the token price provided a proper breakout from the resistance trendline and initiated a significant up movement.
On its previous rally, the MANA token struggled to give a candle closing both in daily and 4hr time frames. Thus, the crypto trade can wait for the price to sustain above this level before initiating a new long position.
The traditional pivot shows remarkable confluence with the MANA/USD chart level. According to these pivot levels, the nearest resistance for this token would be at $3.6, followed by $4 and later $4.6. The token price is currently trading at the $3.34 mark with an intraday gain of $25.3%.


