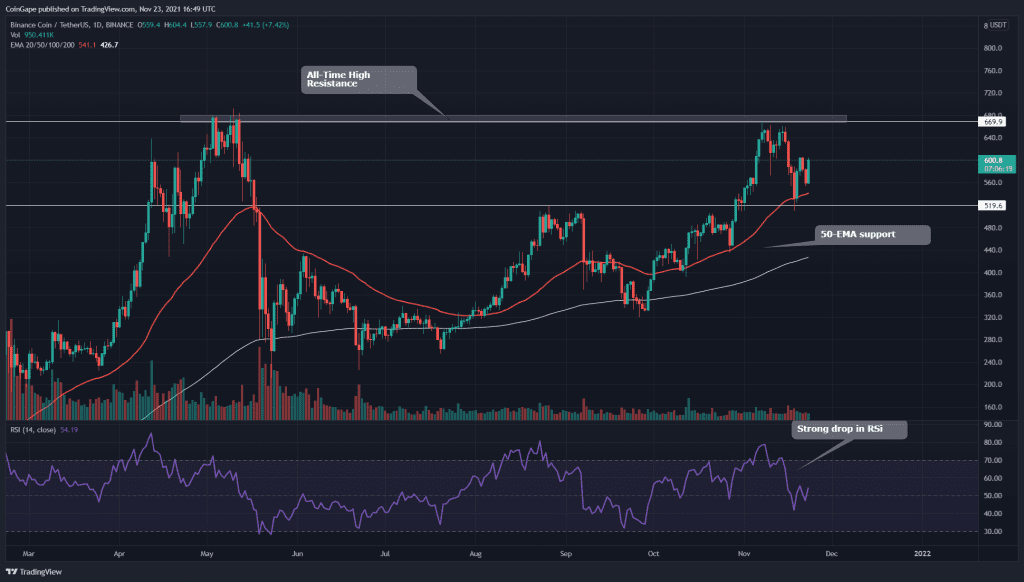
The Metaverse tokens are on the run again. Some of the key news that caught the attention of the crypto investors was ‘bytedance,’ which is the parent company of TikTok, entering into the Metaverse ecosystem. Moreover, the Token’s.com subsidiary ‘Metagroup’ bought a plot of virtual real estate on Decentraland worth $2.4 million. The MANA token has surged around 28.4% in its intraday session.
Key technical points:
- The MANA token price obtains dynamic support from the 20-day EMA line
- The daily RSI chart line is struggling to keep up with the token’s price action
- The intraday trading volume in the MANA token is $6.9 Billion, indicating a 63.4% gain
Source- MANA/USD chart by Tradingview
As mentioned in my previous article on MANA/USD, the token price bounced back from 0.618 Fibonacci retracement level to continue its rally. In this recovery phase, the token provided a great entry long opportunity when the price breached the neckline of the Cup and Handle Pattern in the 4-hour time frame.
The MANA token is now steadily moving north and has even breached the All-Time High of the $5 mark. The token displayed a long bullish candle of 28.4% gain in the last 24-hour, supported by a significant volume activity.
The MANA token displays a bullish alignment in the crucial EMAs(20, 50, 100, and 200). Moreover, The Relative Strength Index(74) suggests a positive sentiment among the token buyers; however, the bearish divergence in RSI is still a matter of concern.
MANA/USD Chart In The 4-hour Time Frame

Source- MANA/USD chart by Tradingview
After the correction phase, the MANA token price resonated in a rising channel pattern leading this new rally to higher levels. However, the increasing buying pressure from the crypto investors resulted in a bullish breakout of the channel pattern and the $5 mark simultaneously.
The token is currently retracing back to retest this support, and if the price manages to sustain above them, the crypto traders could get an excellent long opportunity to go long.
.
.
.
.
.
.
.
.


