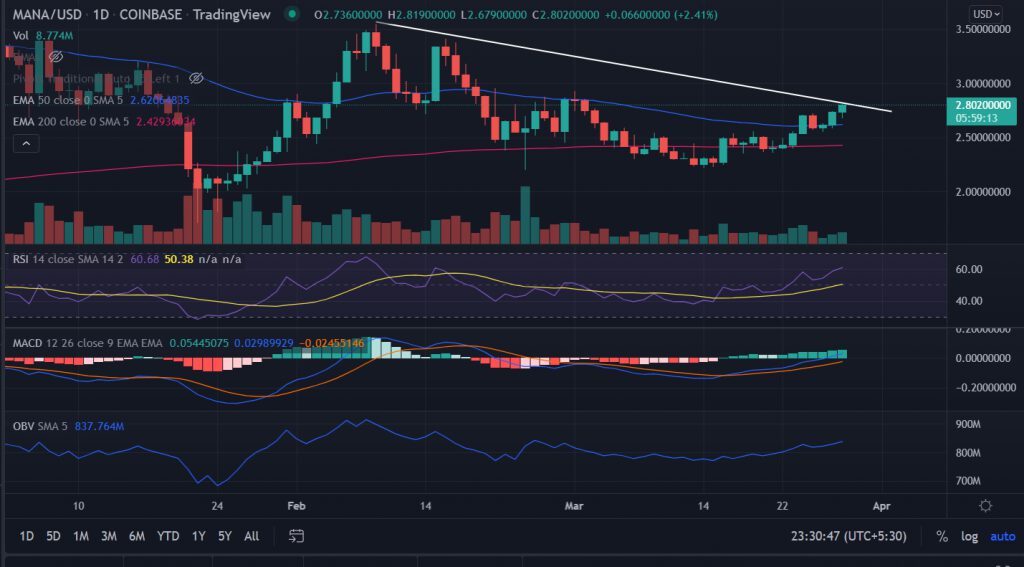
MANA price looks convinced to bring in more gains as it extends the previous week’s gains. An acceptance above the downside trend line will set up a roadmap for the continuation of the upside momentum.
- Mana price trades higher with respectable gains.
- A break above the descending trend line amid buying pressure will see more gains towards $3.40.
- The immediate downside could be found at the 50-day EMA at $2.62.
MANA price looks for further upside gains
On the daily chart, the MANA price is facing an upside barrier near the descending trend line from the highs of $3.55 made on February 9. However, the price stands comfortably above two crucial moving averages of 50-day and 200-day EMAs at $2.61 and $2.42 respectively.
In addition to that, the trading volume also supported the current price action. A break of the bearish slopping line will open the gates for further gains in the asset.
A daily close above the bearish trend line with sustained buying pressure will target the horizontal $3.20 resistance level.
Next, market participants will aim for the highs of February 16 at nearly $3.40.
Best optionsEarnEarn 20% APRClaim5 BTC + 200 Free SpinsWalletCold Wallet
On the flip side, a fall below the session’s low will invalidate the bullish theory for the price. The first downside target could be found at the 50-day EMA at $2.61.
A resurgence in the downside pressure would further exploit the horizontal support level at $2.40.
As of writing, MANA/USD is trading at $2.76, up 0.99% for the day with a 24-hour trading volume of $487,761,731 according to the CoinMarketCap.
Technical indicators:
RSI: The daily Relative Strength Index traded above the average line. It currently reads at 60 which indicates the market is still far from over-heating.
MACD: The Moving Average Convergence Divergence inches above the midline with a bullish bias.
Trending Volume: The On Balance Volume indicator shows increased demand pressure along with gains in price.


