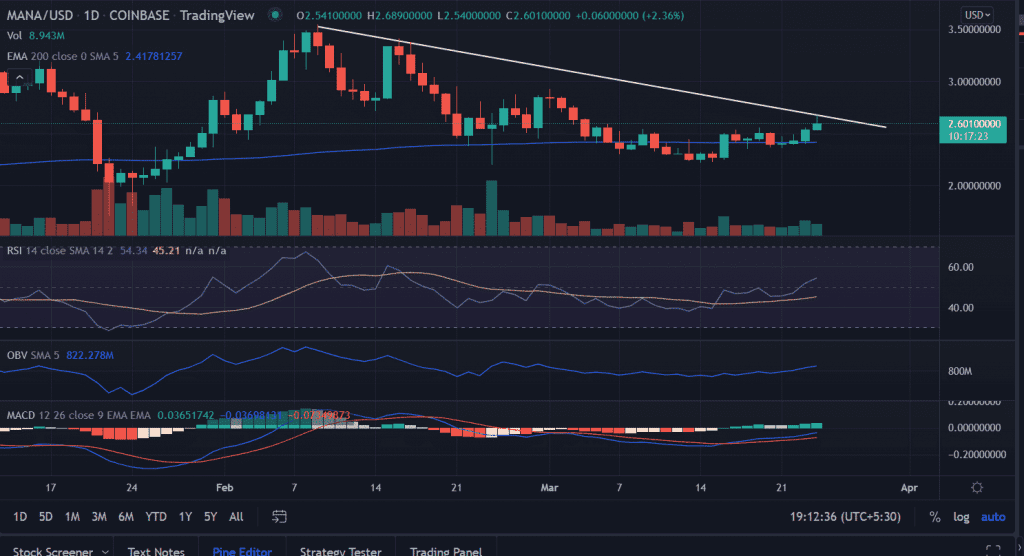
Mana price prints gain for the fourth straight day on Thursday. Although, the price moves in a range-bound manner but with a bullish bias. The price touched two-week highs near $2.60. Thus, resulted in the breaking of a short-term trading range.
- MANA price trades higher with significant gains.
- A daily close above $2.60 will set the direction for $3.50.
- The 200-SMA capped the downside risk in MANA price.
As of publication time, MANA/USD reads at $2.60, up2.44% for the day with a 24-hour trading volume of $779,272,033 according to the CoinMarketCap.
MANA price ready to move further up
On the daily chart, the descending trend line acts as a strong resistance barrier for the bulls, which extends from the highs of $3.55. The price attempted to cross the resistance line on February 9 but failed to do so. In addition to that, depreciated nearly 30% from the February 16 highs and briefly fell below the critical 200-day EMA (Exponential Moving Average) at $2.41.
Currently, the MANA price is again making an attempt to breach the bearish slopping line. If that happens, in that case, the road will be clear for $3.0 next.
Furthermore, an acceptance above $3.0 with sustained buying pressure will take out $3.50 easily.
Best optionsEarnEarn 20% APRClaim5 BTC + 200 Free SpinsWalletCold Wallet
On the other hand, a failure to give a daily close above the trend line will invalidate the bullish outlook. The first downside target is placed at $2.40, which coincides with the 200-EMA.
Technical indicators:
RSI: The daily Relative Strength Index pierced above the average line with strong bullish momentum. It currently reads at 52.
MACD: The Moving Average Convergence Divergence attempted to cross above the midline. An uptick in the indicator will strengthen the upside outlook.
Trading volume: The On Balance Volume (OBV) rose in accordance with the price indicating increased demand as the price gained.


