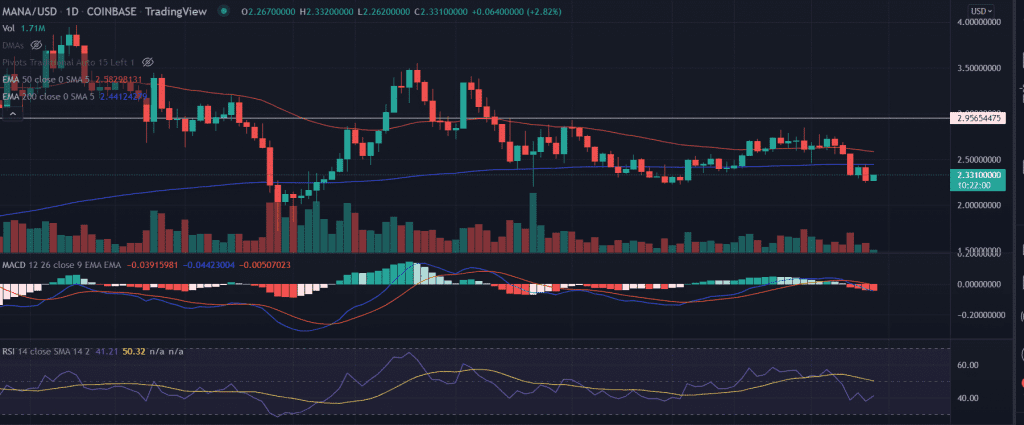
MANA price consolidates near the vital support level suggesting sellers might be exhausted. Still, the price remains vulnerable to volatility towards the make or breakpoint. If the MANA buyers are able to hold above the key $2.50 level it would trigger another run-up in the asset.
- MANA price manages to trade in green on Saturday.
- The price takes support near the demand zone extending from $2.50 to $2.25.
- A daily candlestick below $2.20 would invite more sellers on board.
As of press time, MANA/USD is trading at $2.26, up 2.29% for the day.
MANA price seeks upside reversal
MANA price faces multiple rejections near the $2.80-$2.85 supply zone. As the bulls lack the conviction to carry forward the gains on the daily chart. After tagging the recent highs at $2.85 on March 31, the price retraced 25% to the recent lows.
Furthermore, the MANA price sliced both critical moving averages of the 50-day EMA and the 200-day EMA at $2.58 and $2.44 respectively.
However, as the buyers found the multi-month support around $2.25, the price bounce backed to print some healthy gains is expected.
A sustained buying pressure would first meet yesterday’s high of $2.44. Next market participants would keep their eyes on the horizontal resistance zone at $2.95.
On the flip side, if the mana price breaks the vital support around $2.20 it would invalidate the bullish outlook. On moving down, immediate support is located around $2.0, the level last seen in January.
Technical indicators:
RSI: The daily relative strength index trades near the oversold zone indicating a bounce back is expected.
MACD: The moving average convergence divergence convergence slides below the midline with a bearish sentiment.
Volumes: The 24-hour trading volume stands at $2,62,837,806 with more than 6% gains.


