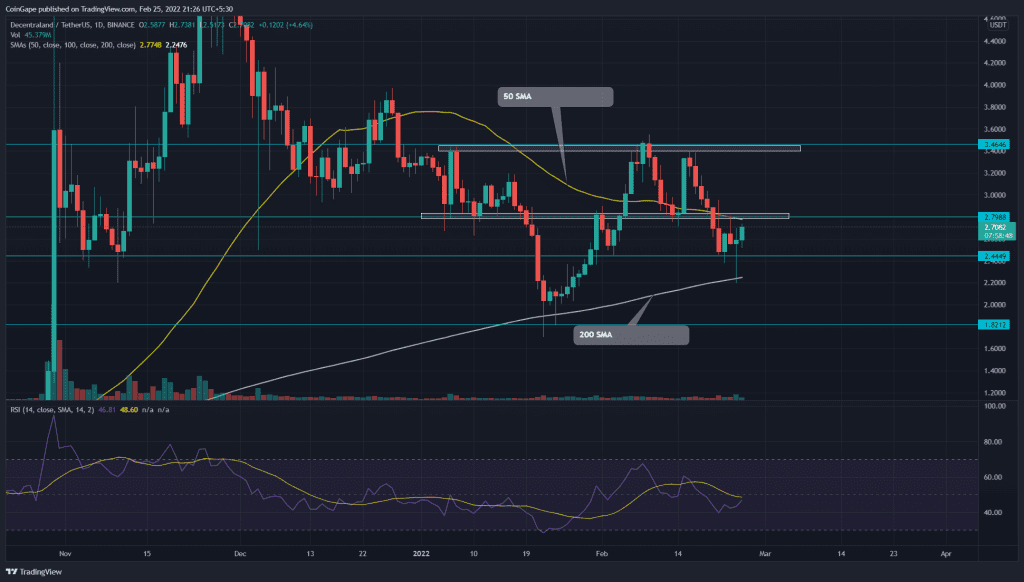
On February 24, Decentraland (MANA) bears attempted to dump the coin below the $2.45 support. However, the intense demand pressure from this level rejected the altcoin from the 200-SMA, resulting in a 21% follow-up rally. The buyers would soon rechallenge the overhead resistance $2.8 mark to kick start with recovery.
Key technical points:
- The MANA price has sandwiched between the 50-and-200-SMA
- The 24-hour trading volume in the Decentraland token is $1.37 Billion, indicating a 3.37% loss.
Source-Tradingview
On February 16th, Decentraland (MANA) price failed its second to breach the high swing resistance of $3.42. The following reversal slumped the coin by 29.5%, dropping to the $2.45 support. Moreover, the technical chart displayed a double top pattern and a breached breakout from the $0.28 neckline, accelerating the ongoing selling.
With a successful retest to the breached support, the sellers headed to their next target of $2.45. However, the long-tail rejection on Feb 24th indicates the bulls mount strong support at this level.
The Relative Strength Index(46) slope approaches the neutral line from below. A bullish crossover above the 14-SMA line and midline would provide additional confirmation for long traders.
The MANA price is resonating between the 50 and 200-day SMA. A breakout from either of these levels would offer an extra edge for the following trend.
MANA Price Breached The Descending Trendline

Source- Tradingview
Today, the MANA price is green and shows a 9.87% from the base support. The coin chart shows the buyers also provides a bullish breakout from the descending resistance trendline. A retest of this trendline should confirm the sufficient demand and bolster the buyers to break out the $2.8.
If they succeed, the buyers have their next stop at 23% high to $3.45. Alternatively, a possible reversal from $2.8 resistance would sink the price back to the $2.45 mark.
- Resistance level: $2.8, $3.45
- Support level: $2.45, $2.2


