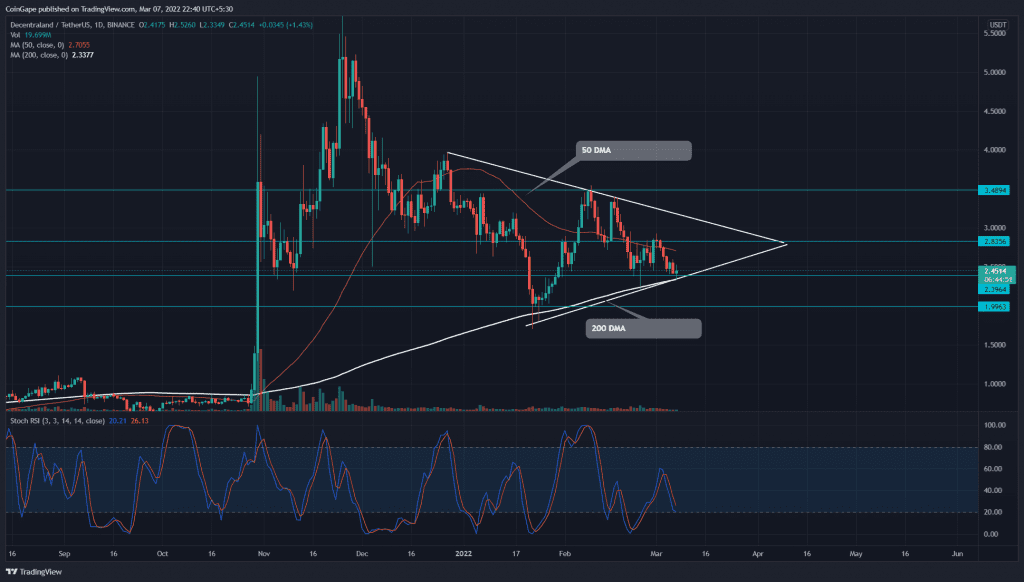
Decentraland (MANA) price has been resonating inside a symmetrical triangle for the past several weeks. The weekly chart shows four consecutive red candles, which plunged the altcoin to the support trendline of the triangle pattern. A bullish reversal from the $2.4 support would continue the range-bound rally in MANA.
Key points:
- The MANA chart shows a bearish crossover among the 20 and 50-day MA
- The 24-hour trading volume in the Decentraland token is $408 Million, indicating a 34.5% gain.
Source-Tradingview
The correction phase initiated during February’s second week tumbled the MANA/USDT pair by 32% and slumped it to $2.4. Last week the buyers tried to bounce back from this support($2.4) and drove the altcoin to immediate resistance of $2.8.
However, the sellers maintained a strong defense at this level and reverted the coin price to swing low support. The technical chart shows a symmetrical triangle pattern in play with the MANA price currently located at the bottom support trendline.
The MANA price moving above the 200-day MA maintains a bullish tendency. However, a bearish crossover of the 20-and-50-day MA bolsters the sellers to extend the correction rally.
The Stochastic RSI indicator shows a steady bear cycle with the K and D lines diving into the oversold region. Furthermore, the oversold indicator value could help buyers surge the coin to higher levels.
Doji Candle Halts Ongoing Price Correction.

Source- Tradingview
The MANA chart shows a daily-Doji candle at the shared support of $2.4 and 200-day MA, suggesting indecision in the market. A bullish reversal from this level would indicate the traders are buying at this dip and would rally to the overhead resistance.
Alternately, If the sellers plunged the altcoin below the $2.4 support, the renewed selling pressure would sink the price by 16.5%, hitting the $2 psychological level.
- Resistance level: $2.83 , $3.48
- Support level: $2.4, $2


