The DeFi index (DEFIPERP) has been moving upwards for the entirety of December and could soon break out from a descending resistance line.
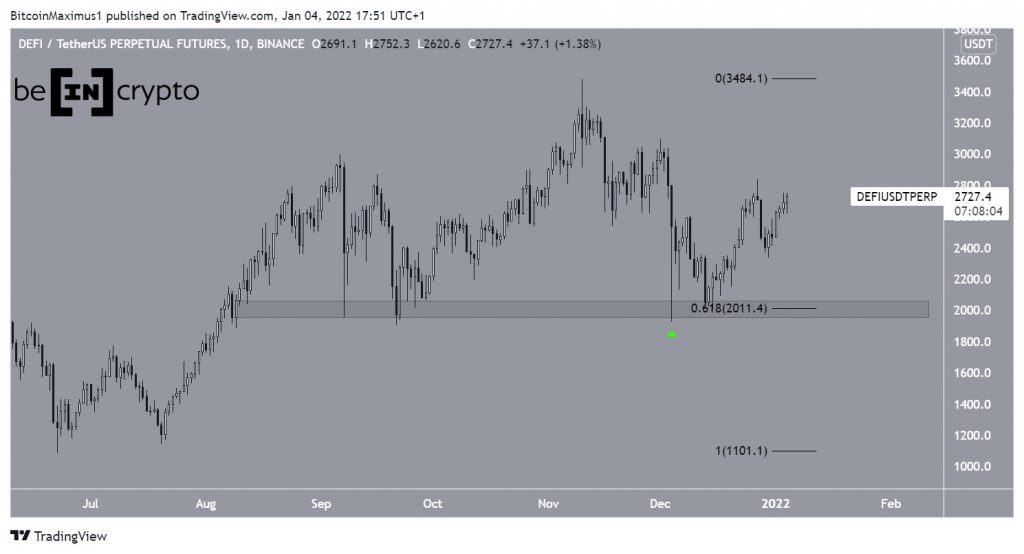
On Dec 4, DEFIPERP reached a low of $1,927 and bounced considerably, creating a very long lower wick (green icon). This is considered a sign of buying pressure. The bounce also served to validate the $2,000 area as support. This is both a horizontal support area and the 0.618 Fib retracement support level.
The index has been increasing since and reached a high of $2,837 on Dec 27. After a short-term drop, it initiated an upward movement that is still ongoing.
Breakout attempt
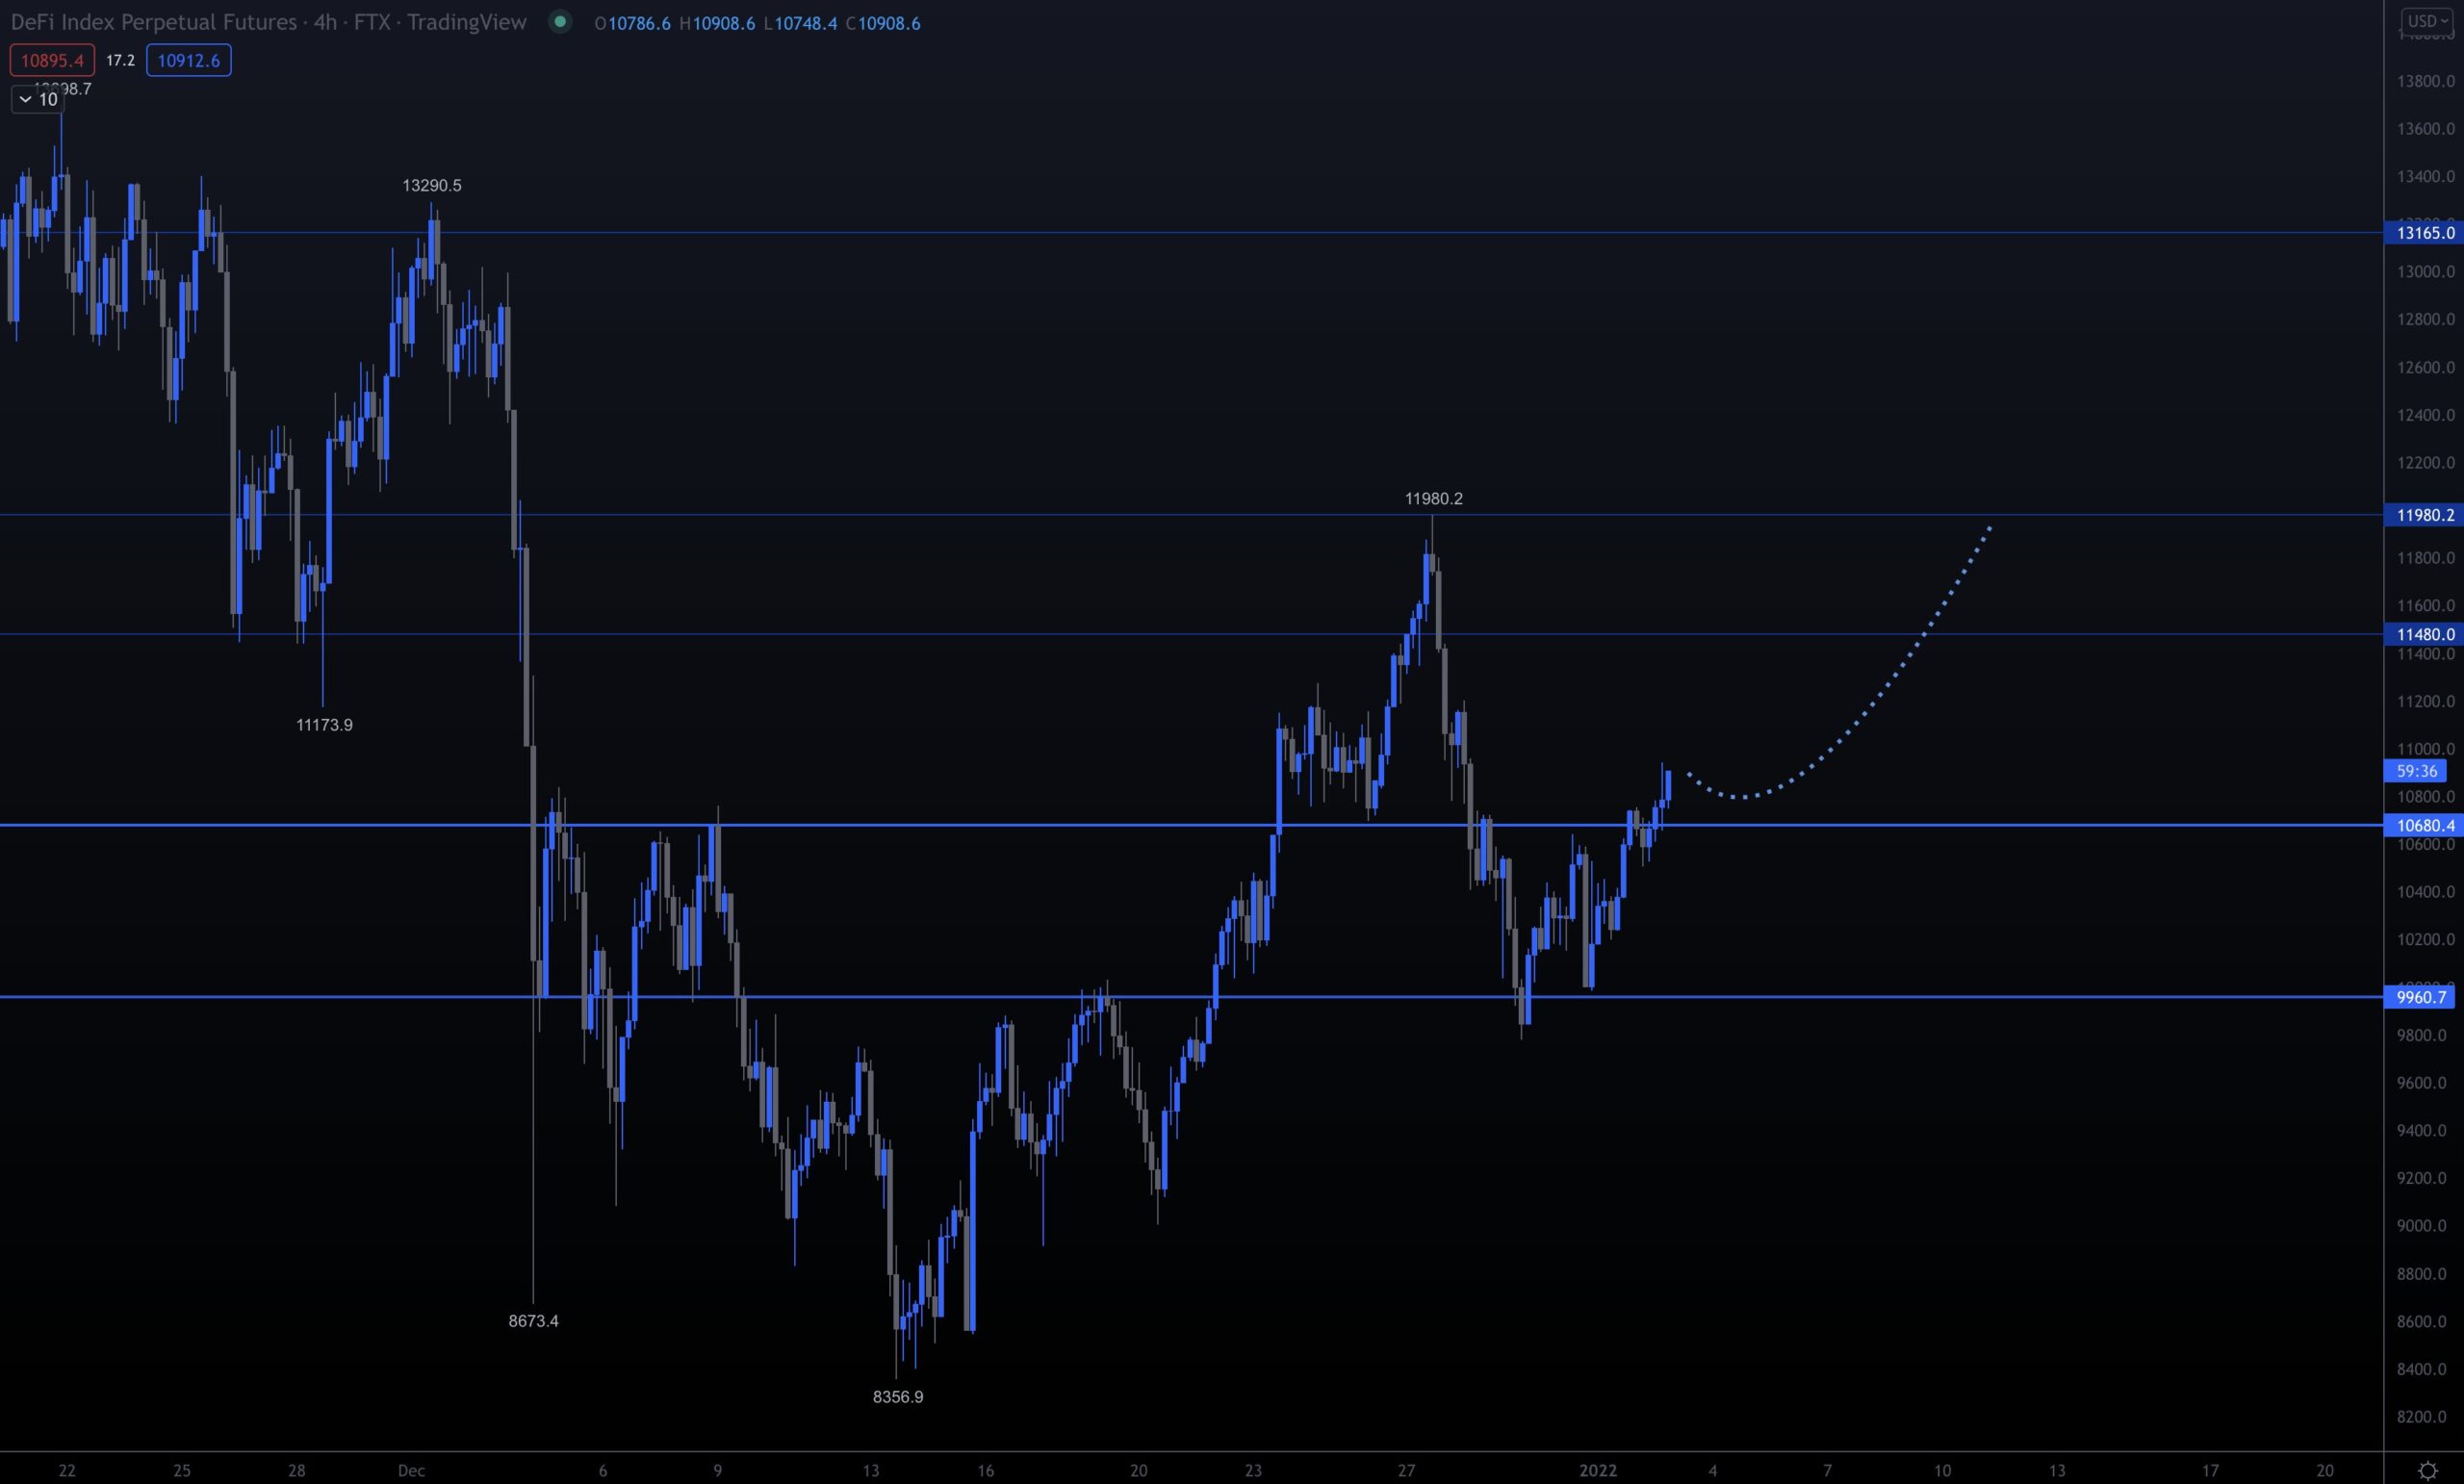
Cryptocurrency trader @TradingTank tweeted a chart of the DeFi index, stating that an increase is expected.

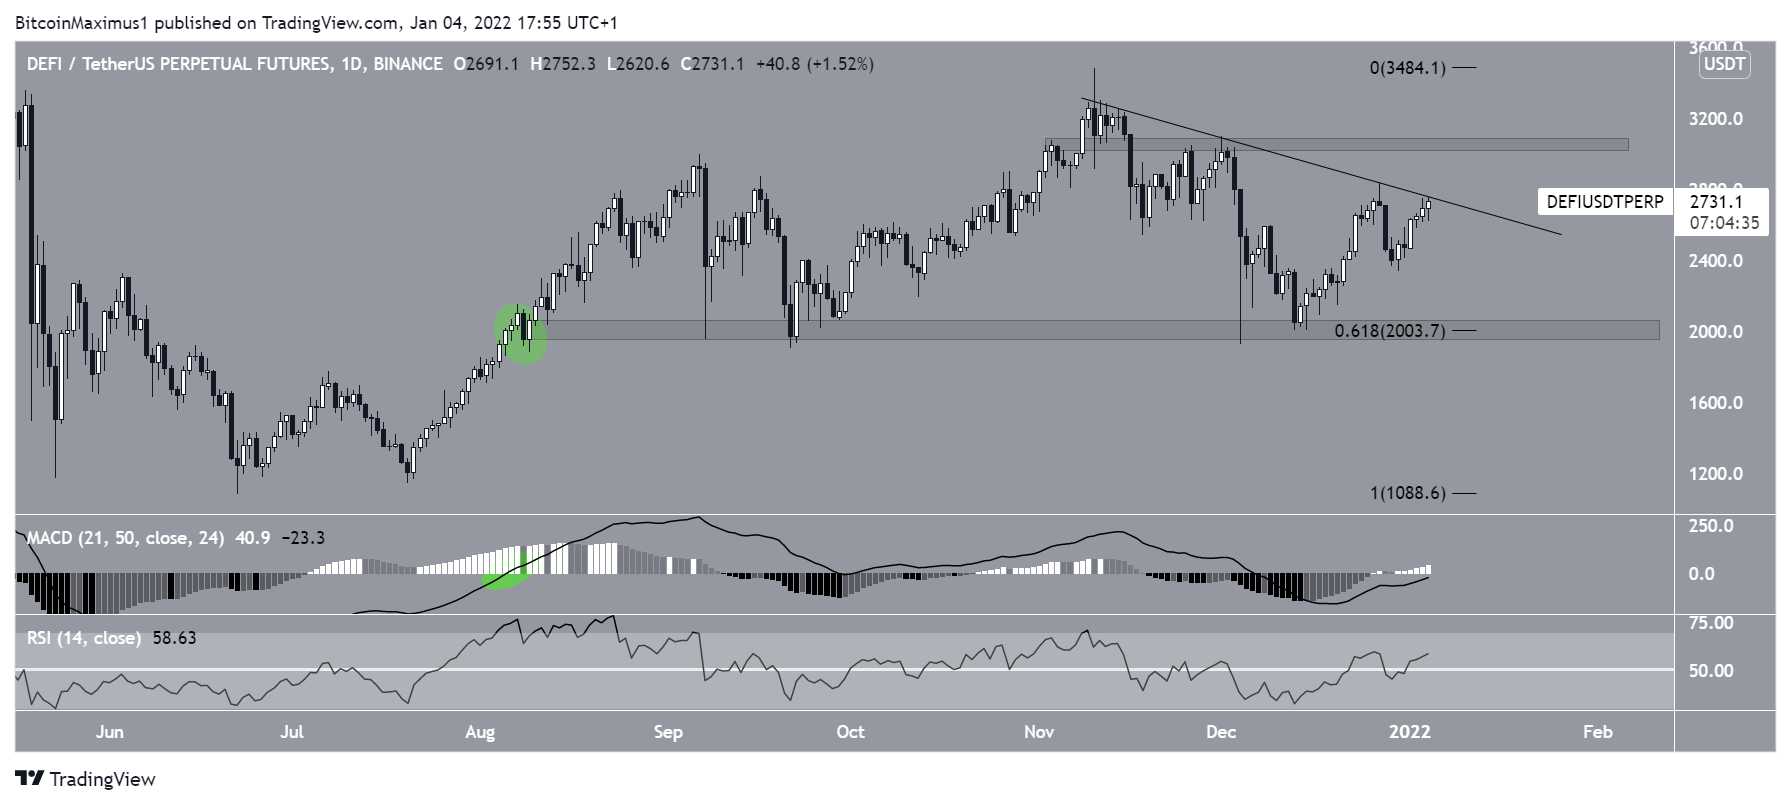
DEFIPERP is currently making an attempt at breaking out from a descending resistance line that has been in place since Nov 10. This would confirm that the ongoing correction is complete.
Technical indicators support the possibility of a breakout.
The MACD, which is created by a short- and a long-term moving average (MA), is moving upwards and is nearly positive.
The previous time such a movement transpired in the MACD was on Aug 2021 (green circle) and preceded the upward movement to the current yearly high.
In addition to this, the RSI is moving upwards and is above 50. This is a sign of bullish momentum and supports the readings from the MACD.
If a breakout transpires, the closest resistance area would be at $3,050.

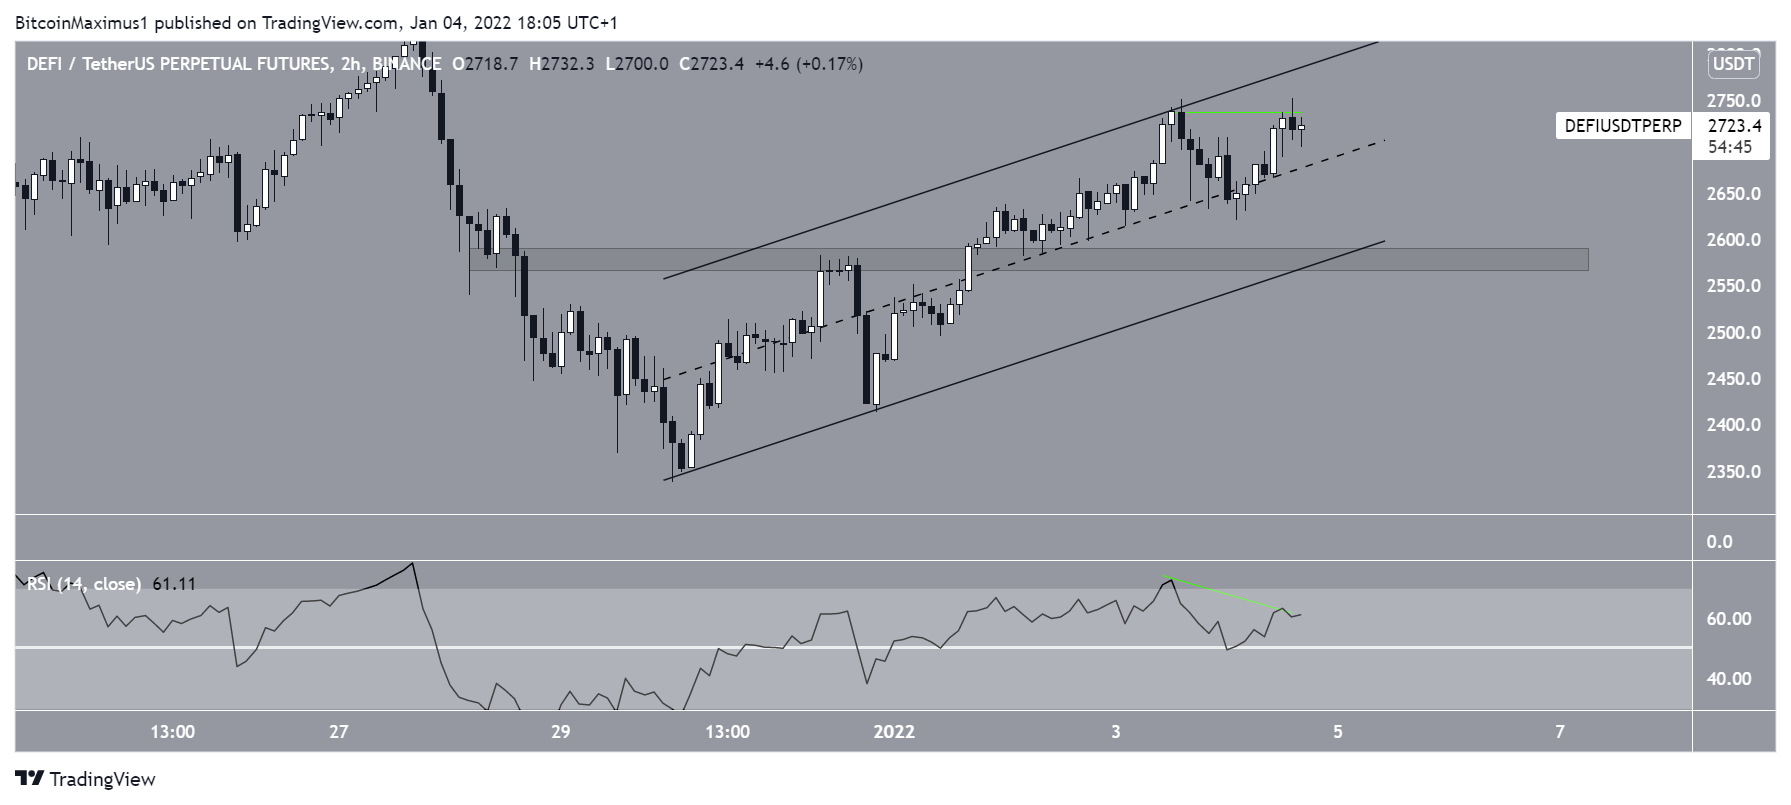
However, the two-hour chart is showing some slight signs of weakness.
Firstly, DEFIPERP is trading inside an ascending parallel channel, which is considered a corrective pattern. This means that a breakdown from the channel would be the most likely scenario.
Secondly, there is a considerable bearish divergence that has developed in the RSI. This often precedes drops.
Therefore, it is possible that a short-term drop will transpire prior to the eventual breakout. If one occurs, the support line of the channel and the $2,580 area would be expected to initiate a bounce.

For BeInCrypto’s latest Bitcoin (BTC) analysis, click here.
Disclaimer
All the information contained on our website is published in good faith and for general information purposes only. Any action the reader takes upon the information found on our website is strictly at their own risk.


