Bitcoin has had a rough start this year, with its prices still ranging between $45,850 and $48,500 as the market awaits a miracle to unfold.
At press time, with the king coin oscillating at $46,276 noting 1.55% daily and 6.18% weekly losses the market looked rather dull to many, as the total crypto market cap sat at $2.21 trillion noting a 1.31% decrease over the last day.
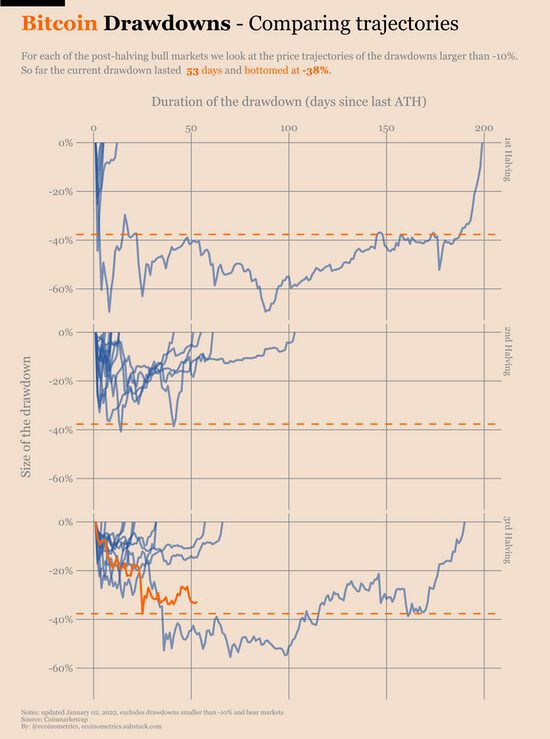
Nonetheless, by comparing the recent BTC drawdown to the other corrections of the same size, it was observed that close to 40% dips were getting bought faster. So far the current drawdown lasted 53 days and bottomed at -38% from the most recent ATH. Still, it sort of resembles those silent periods of no movement that have lasted around 200 days in the past.
So while BTC can see the same parabolic moves it saw over the past cycles, it can also see the same downside. For now, this cycle doesn’t look so bad looking at the much higher losses over the previous cycles. But at the time of writing as BTC tested the lower bounds yet again, some things were changing.
Buying the dip
BTC’s choppy price seems to have attracted whales back to the scenes as one of the biggest Bitcoin whale is back in 2022 making a big order. Data from Bitinfocharts shows that the third-largest Bitcoin address has added 456 BTC at an average price of $46,363 on 4 January.
The buy was worth around $21 million and amid choppy price, action presents the ‘buy the dip’ sentiment shown by the whale.
That said, looking at the larger market the small fish have bought the dip all the way down to $47,000 but were starting to slow down while whales had been distributing coins quite aggressively at the end of the year. For now, with a whale buying the dip the same can push BTC’s price in the near future.
However, the Exchange Whale Ratio is currently above 90% which means that 90% of the Bitcoin that gets deposited on Exchanges is from the top 10 inflow transactions. Larger players are depositing a larger amount of Bitcoin at the lower levels which could be something to be careful of.
What lies ahead?
BTC’s 1+ Year HODL Wave tells what percentage of coins in circulation haven’t moved in over a year. It helps identify BTC bull and bear market cycles. Approximately 57.12% of all coins in circulation haven’t moved in over a year but it was down 6.8% points from a local top of 63.4% set on 9 September in 2020.
Before hitting a local high, a gradual increase in the +1 Year HODL wave signals that market participants are accumulating which could be seen at the moment and was a good sign.
Further, BTC transaction fees are at their lowest levels while the average number of tokens transferred is making lower highs. Also, transaction counts are in the lower region, which makes the Bitcoin network relatively cheaper making it a good time to invest.


