Disclaimer: The information presented does not constitute financial, investment, trading, or other types of advice and is solely the writer’s opinion
- The drop below $79 flips the market structure to bearish
- Some outflows from the exchanges suggest a mild possibility of a bullish scenario
Since 5 November, USDT (Tether) Dominance shot upward from 6.81% to 8.38%. This showed that market participants fled from crypto assets into holding stablecoins such as Tether. Fear dominated the markets in the wake of the news about FTX’s insolvency. Aave performed quite well in the past month.
Read Aave’s [AAVE] Price Prediction 2023-2023
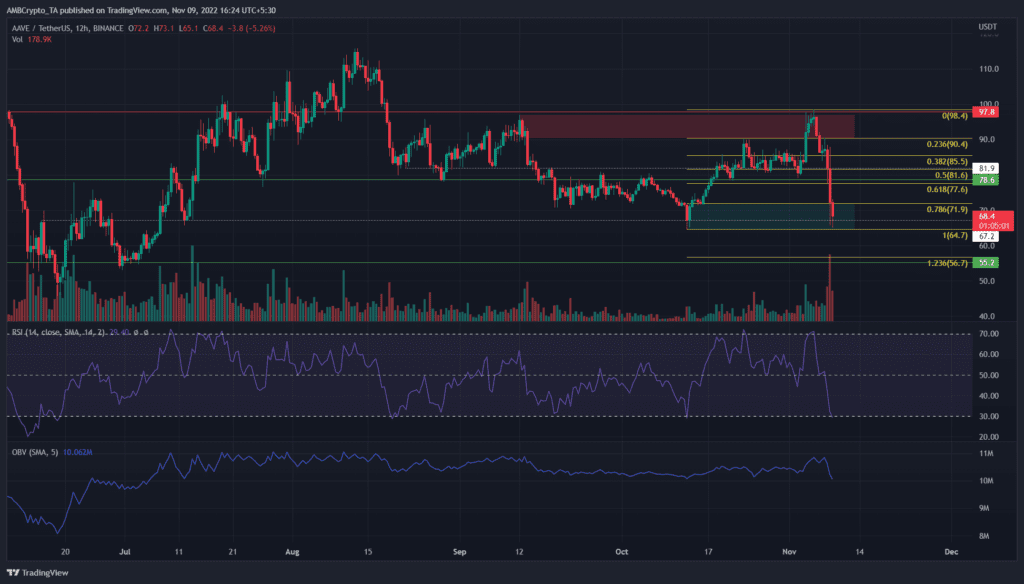
It rallied nearly 45% from $67.2 to $98.4 but has retraced almost all of those gains within a week. In other news, the partnership between Aave and Balancer could give token holders an opportunity to put their tokens to work rather than just holding on to them.
Significant support levels have been broken and traders can continue to lean bearish
On the 12-hour chart, Aave formed a bullish order block in the vicinity of $72 back on 13 October. AAVE dipped once more into this order block and this presented higher timeframe traders with an opportunity to enter long positions.
However, the market structure was bearish on the 12-hour and daily timeframes. Support levels at $79 and $72 have been broken. Hence, even though the invalidation of a bullish idea was relatively close by, traders might want to be cautious.
Bitcoin’s fall beneath the $18.6k-$18.2k region threw bulls’ hopes out of the window. A deeper correction was certainly possible, and risk-averse traders looking to trade with the trend could look wait for a better risk-to-reward entry into a short position.
The Relative Strength Index (RSI) slipped below neutral 50 and showed strongly bearish momentum. The On-Balance Volume (OBV) also tumbled below a level of support from late September, which extended all the way back to mid-July.
Whether Aave saw further losses beneath $68, or whether a sizeable bounce can materialize over the next few days, remained to be seen. Nevertheless, it was clear that AAVE offered an opportunity to enter a long position with a clear, close-by invalidation. A daily session close below $64.7 can be a signal to close the long positions, and AAVE’s subsequent support level lay at $56.
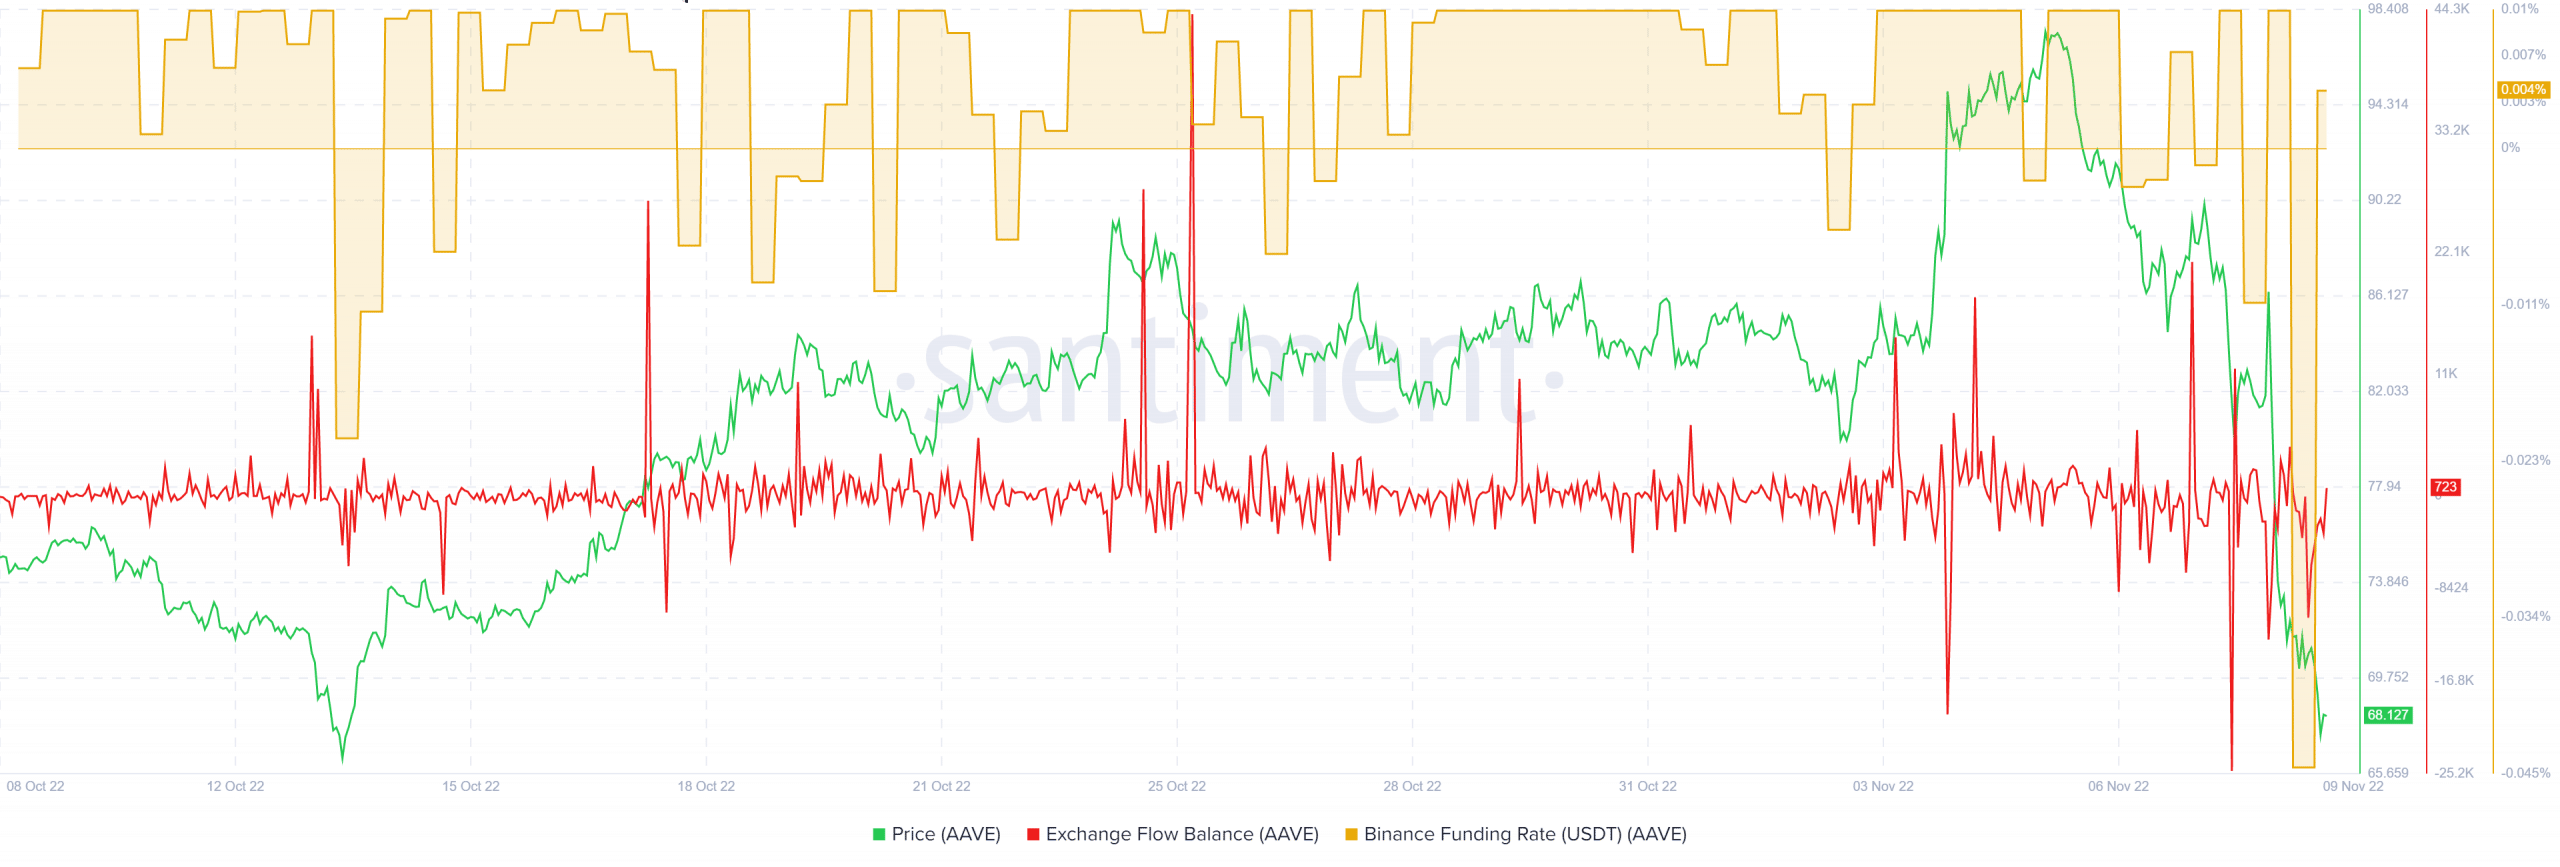
Exchange Flow showed tokens moving out of major exchanges

Source: Santiment
The funding rate of Aave on Binance was mostly positive in recent weeks. AAVE registered a top at $98.4, and since then the funding rate has plummeted into negative territory. A surprising finding from the on-chain metrics was the fact that, in recent days, high inflows of known exchange wallets were not seen. This would have signaled heavy selling pressure was imminent.
On the contrary, the past two days have actually seen tokens flowing out of the exchanges. This suggested there was a possibility of whales accumulating the token despite the significant dump.
If this were the case, Aave could soon turn its bearish momentum around. Yet, it could turn out to be unwise to trade against the wider trend across the market. Instead, a wary trader can wait for signs of a reversal before buying the asset.


