The latest correction phase in Meme coins like DOGE, ELON, and SHIB experienced a significant drop in their price, causing them to lose more than half of their value. However, these coins were dropped to their respective crucial support, where they obtained strong demand pressure to initiate a new rally.
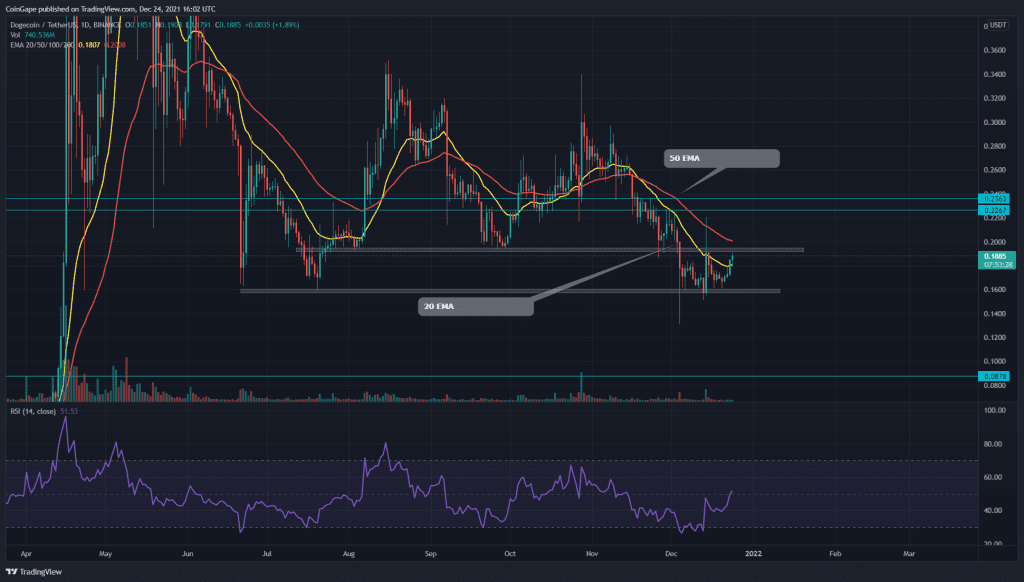
RSI Bullish Divergence Hints Demand Pressure In Dogecoin
Source- DOGE/USD chart by Tradingview
The last time we covered an article on Dogecoin on December 14, the token price jumped 30% of its intraday session and was trying to breach the near resistance zone around $0.193.
However, this rally couldn’t sustain the higher price for long and plunged back to bottom support of $0.16. After this second retest, the token is again ready to challenge the overhead resistance of $0.193.
The pair managed to flip the dynamic resistance of the 20-day EMA into possible support. Moreover, the daily Relative Strength Index(51) shows an evident bullish divergence in its chart, indicating the rising command of the market buyers.
DOGE Token Trying To Knockout Another Resistance
Source- Tradingview
The recent correction phase is Dogelon Mars token formed a descending triangle pattern in the daily time frame chart. This pattern usually promotes more selling in a token when the price breaks down from its neckline, which in our case is $0.000001 or 0.168 Fibonacci retracement levels.
However, this token’s recent listing announcement on a well-known exchange, i.e. Gemini and HuobiGlobal caused a parabolic rally in its price, resulting in a bullish breakout from the price pattern.
The ELON/USD pair surged around 70% from the bottom support and is currently facing strong resistance of $0.0000018. If the price fails to breach this overhead resistance, the price could plunge back to $0.0000013 or $0.000001 support.
With this recent rally, the token price reclaimed the bullish alignment of the crucial EMAs(20, 50, 100, and 200) in the daily time frame chart. Moreover, the token also shows a bullish crossover 20 and 50 EMA, attracting even more buyers in the market.
The daily Relative Strength Index(64) shows a significant jump in its value, supporting the ongoing rally.
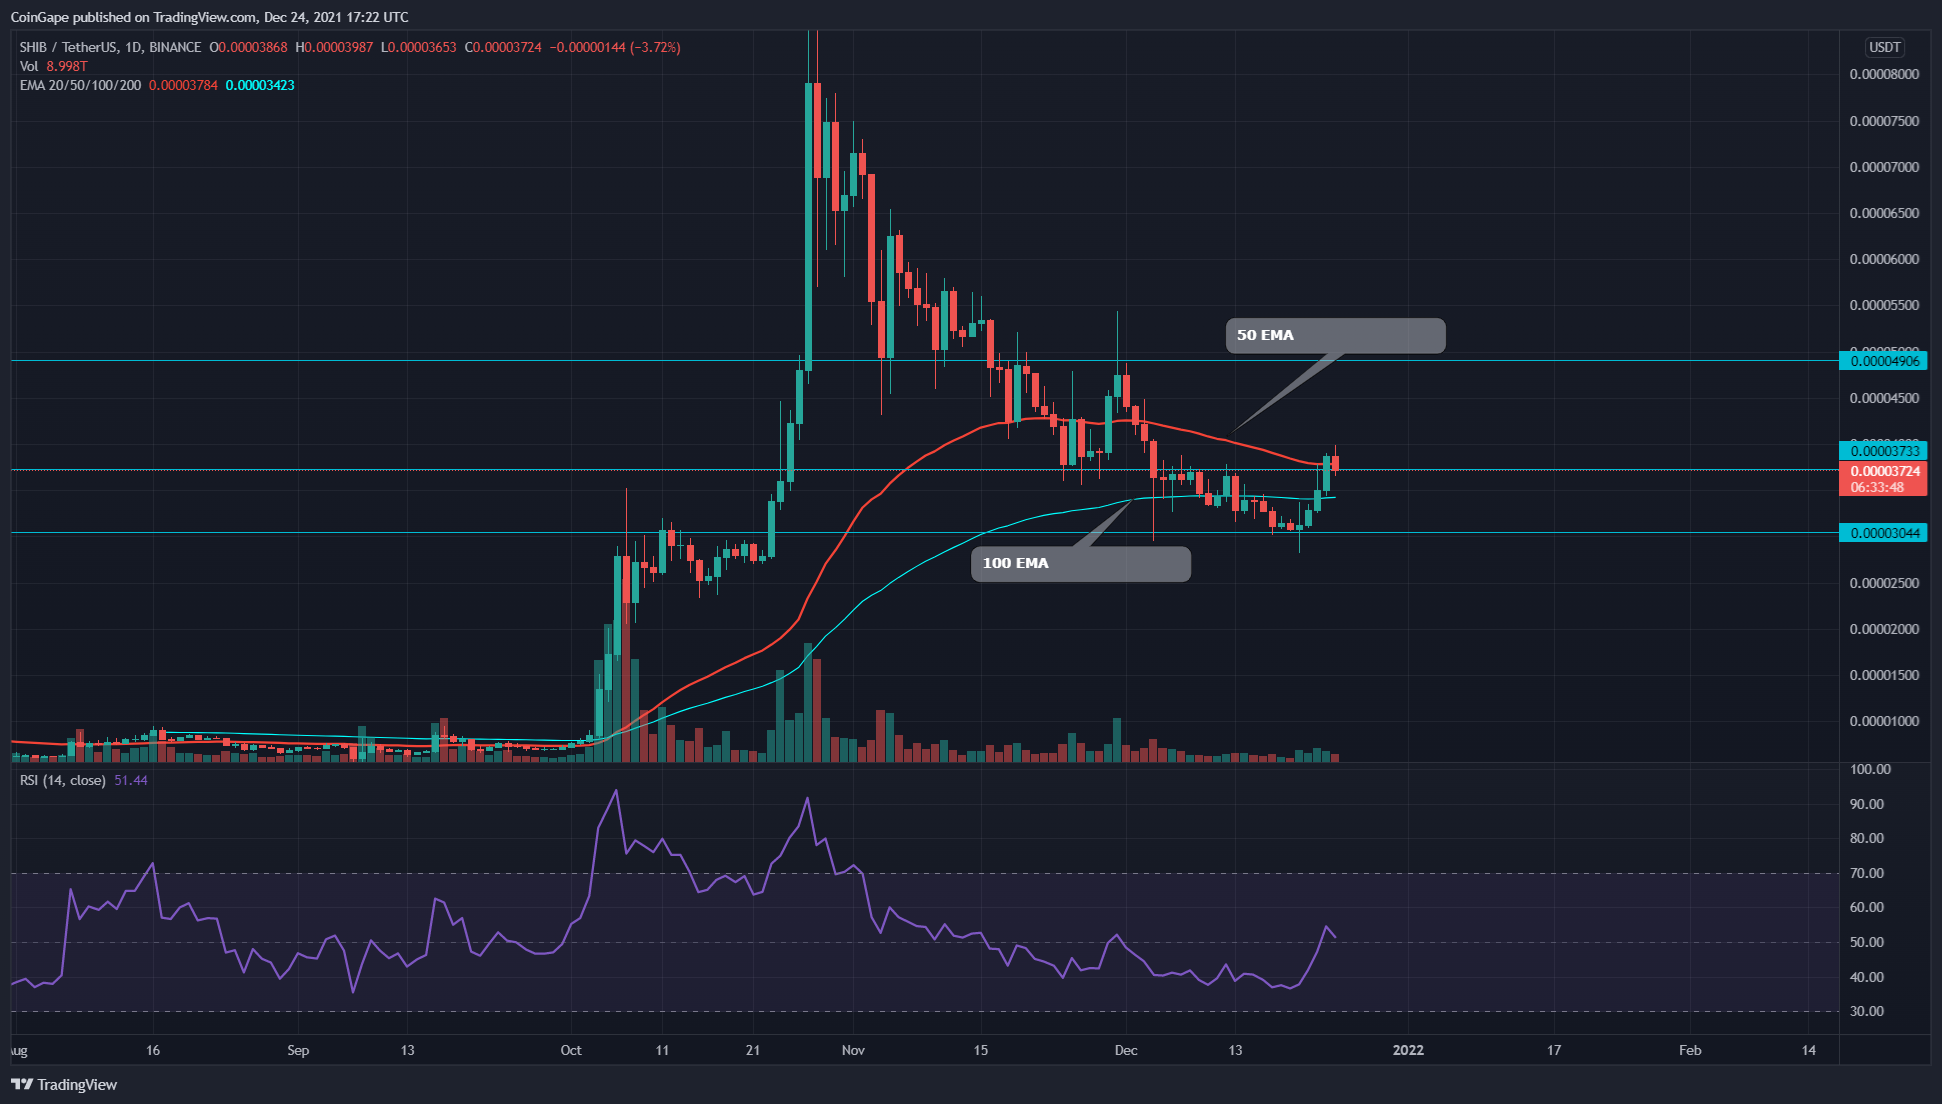
SHIB Token Hints 30% Growth Above $0.0000375 Mark
Source-Tradingview
We recently covered an article on Shiba Inu, where we saw the token price experience intense demand pressure from the $0.00003 support. The pair initiated a V-shaped recovery in price and gained 26% over the last 4 four days.
On December 23rd, the token price breached the overhead resistance of $0.0000375, providing another entry opportunity for crypto traders. However, the price is currently retesting this new support level, which will reinforce the ongoing rally.
Along with the horizontal resistance, the token price is also trying to reclaim the 50-day EMA line. Moreover, the daily Relative Strength Index(51) value crossed above the neutral zone, indicating a bullish sentiment in the price.


