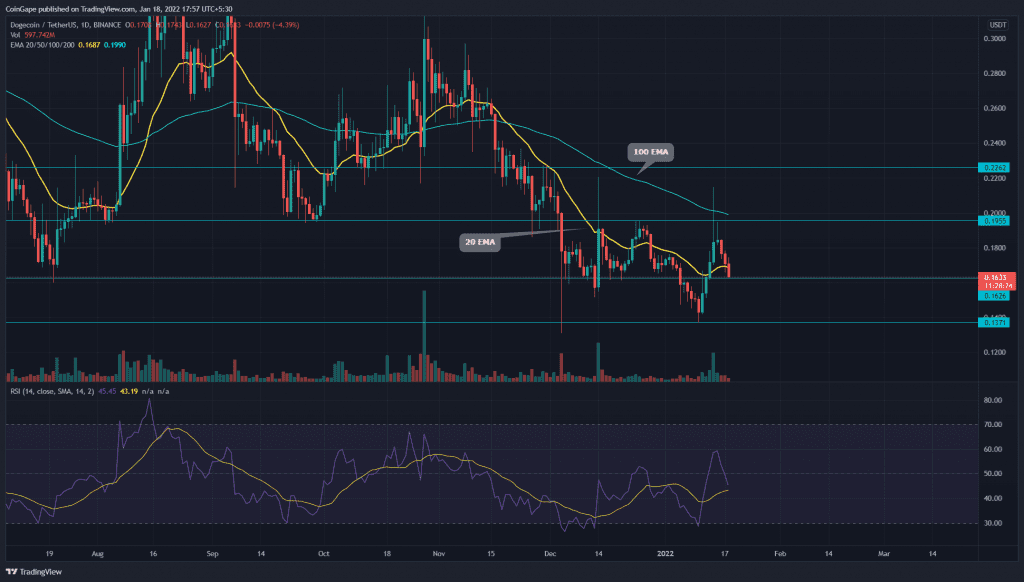
The Dogecoin (DOGE) price showed an impressive recovery last week, hinting to start a new rally. However, the price couldn’t surpass the crucial resistance of $0.195, which eventually rejected the coin price to continue the correction phase. The coin price moving to the lower level is currently halted at a mid support level of $0.163
Key technical points:
- The Dogecoin sellers reclaim the 20-and-50 EMA line
- The 24-hour trading volume in the Dogecoin coin is $1.14 billion, indicating a 12.5% gain.
Source-Tradingview
Recently when we covered an article on the Dogecoin, the DOGE price failed to sustain above the $0.195 resistance even after getting a sudden pump from the billionaire Elon Musk’s tweet saying the Tesla merchandise can be bought using Dogecoin.
Though this celebrity drive rally presented a high gain in the first half of January 14th, the overall bearish trend brought the supply pressure again and rejected the price with an evening star candle pattern.
This bearish reversal in price action has again engulfed the crucial EMAs(20, 50), indicating a bearish alignment in the daily chart. The technical chart shows the price is getting strong resistance from these EMA lines.
The daily Relative Strength Index (46) slope has dropped below the midline(50), projecting a bearish sentiment in the coin.
The DOGE Price Wobbling In A Falling Wedge Pattern

Source- Tradingview
Ever since the bloodbath of 4th December 2021, the DOGE coin buyers are struggling to sustain the coin price above $0.195. The price has faced several rejections from this resistance, eliminating any attempt to rally higher.
With its recent reversal from this overhead resistance, DOGE price is charging back to the current lower low support of $0.137. However, as far now, the price has reached mid-support of $0.163, which could halt the ongoing bear attack.
The technical chart shows a falling wedge pattern, whose breakout could signal a bullish reversal from this support.
Under the influence of bearish momentum, the Bollinger band has started to curve lower. Moreover, the price has also dropped to the lower band, trying to control the down rally.
- Resistance levels- $0.19 and $0.22
- Support levels- $0.16 and $0.137


