The crypto market started the year treading on a tight wire and situation keeps getting worse by the day, with the entire crypto market cap dropping below the $2 trillion mark late on Thursday according to data from CoinMarketCap. Meme coins have not been left behind as they dropped both in price and market value.
Shiba Inu is close to reaching the target of the descending channel at $0.00002813 as analysed on Thursday and was in the process of defending the $0.000030 support level. At the same time defied buying pressure from the $0.16 level and fights to secure support from the $0.1498 level. FLOKI and other small-capped altcoins were also seeking strong support levels to mitigate losses.
Dogecoin stares into an Abyss As $0.1241 Beckons
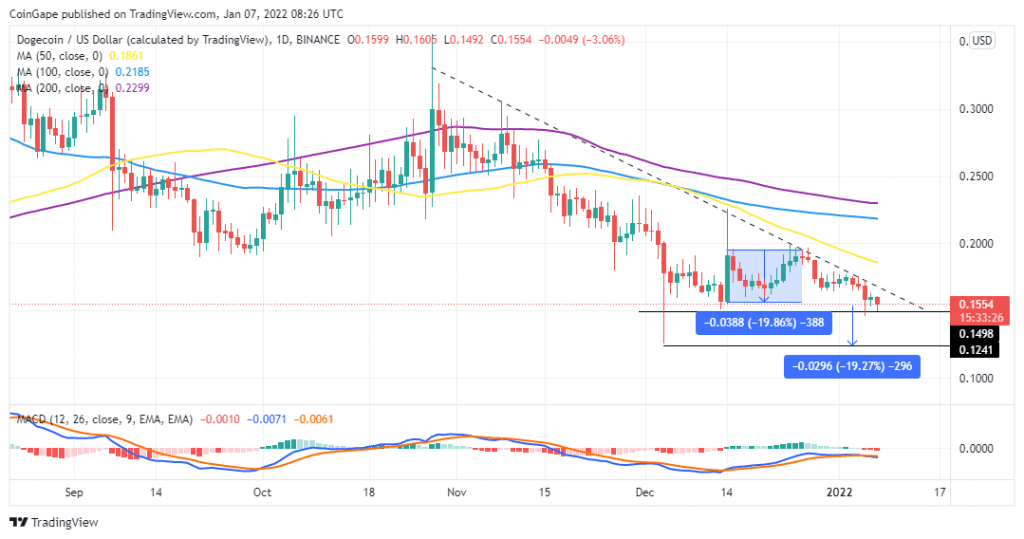
The pioneer meme coin trades in the red at $0.1554 at the time of writing and has formed a descending triangle on the daily chart. As Extreme Fear (15/100) grips the crypto market as shown by Alternative’s Crypto Market Fear And Greed Index with most investors worried that the market would tumble further. Hence, Dogecoin is likely to lose balance and begin another move towards the target of the prevailing chart pattern at $0.1241, representing a 19.27% drop from the current price.
DOGE/USD Daily Chart
Shiba Inu On Last Line Of Defence: Time To Buy?
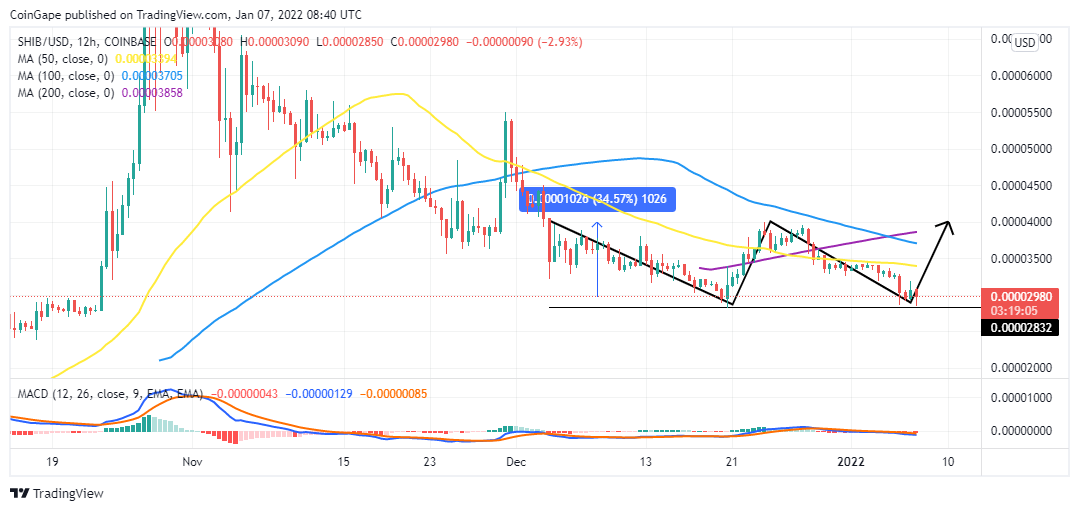
Shiba Inu tanked below the $0.000030 psychological level for the first time since December 20, 2021. This has caused the price of the self-claimed “Doge-killer” drop to lows of around $0.00002812, coinciding with the December 20 low. This is the last line of defence for SHIB which if lost, would trigger massive sell orders that are likely to plunge SHIB further.
On the upside, the 12-hour chart paints a light double-bottom chart with a potential for guiding Shina Inu’s recovery back to $0.000040.
SHIB/USD 12-Hour Chart

Floki Inu Paints Oversold Conditions
FLOKI continued the downtrend after a failed attempt to $0.00010 earlier in the week. Support at $0.0009063 did little to stop overhead pressure this time around with the token extending to discover support at $0.0007176. Failure to hold this support could see FLOKI drop to tag the $0.0006043 support wall.
However, the Relative Strength Index (RSI) has displayed oversold conditions for Floki Inu price as seen on the daily chart. This suggests that the downtrend is perhaps coming to an end and recovery is on the cards.
FLOKI/USDT Daily Chart

Gains above $0.0009063 are needed to kick-start the uptrend and a rise above the downtrend line at $0.00010 will see Floki Inu display a clear bullish breakout upwards.


