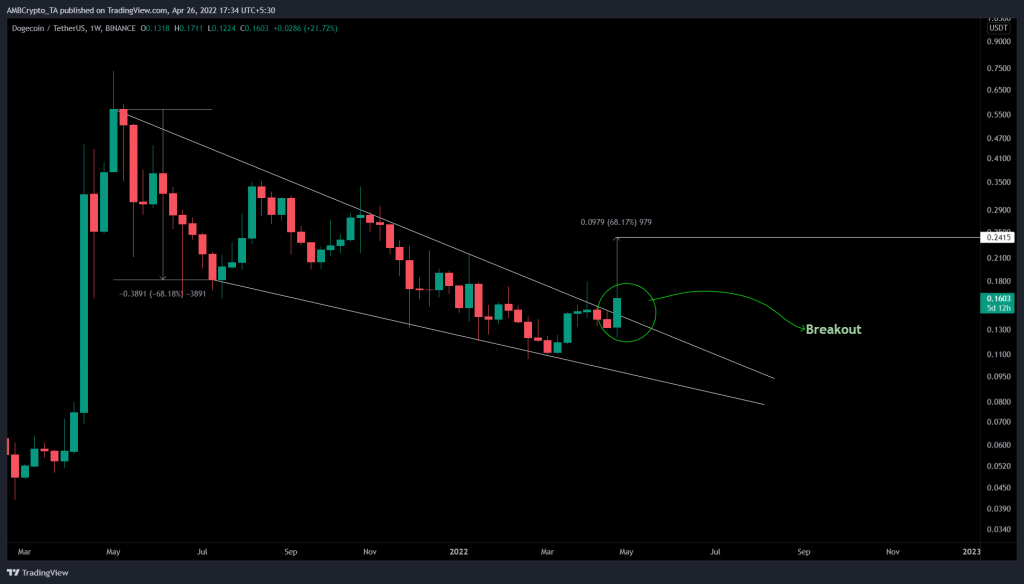
Dogecoin’s price was hovering inside a massively bullish setup, with DOGE having recently broken out of it. This development is extremely bullish not just from a technical perspective, but also from a fundamental outlook.
Therefore, sidelined buyers need to take a closer look at this dog-themed crypto. Especially as humungous gains await in its future.
First signs of explosive moves
DOGE rose by 1,690% from February 2021 to May 2021 and set an all-time high at $0.74. As the crypto-markets saturated and Bitcoin’s price formed a local top, things started to turn around for the worse.
As a result, DOGE crashed by a whopping 85% and created a local bottom at $0.109 on 21 February.
This price action formed three distinctive lower highs and lower lows. Connecting these swing points using two trendlines underlined the formation of a falling wedge.
This wildly popular technical formation forecasts a 68% upswing, determined by measuring the distance between the first swing high and swing low. Adding this measure to the breakout point at roughly $0.139 reveals the target at $0.242.
After nearly a year of downtrends, DOGE has come alive due to the recent happenings in the traditional finance space. Tesla CEO Elon Musk’s offer to buy Twitter at $44 billion was successful and was announced on 25 April.
Considering Musk’s affiliation with Dogecoin developers and his love for the original meme coin, it is apparent that Dogecoin’s price will rally. So far, DOGE has returned nearly 20% on yesterday’s candlestick. At press time, it was hovering above the falling wedge’s upper trendline.
Now, investors can expect DOGE to retest the upper trendline. A successful bounce is likely to propel the meme coin to hit its forecasted target of $0.242.
An important tailwind?
Adding a tailwind to this bullish outlook for DOGE is the 365-day Market Value to Realized Value (MVRV) model. This indicator is primarily used to gauge the sentiment of holders as it tracks the average profit/loss of investors who purchased DOGE tokens over the past year.
Generally, a negative value indicates that these holders are underwater and a positive value indicates that holders are in profit. The probability of a sell-off is high in the latter condition.
Based on Santiment’s backtests, a value between -10% to -15% indicates that short-term holders are at a loss and long-term holders tend to accumulate under these conditions. Therefore, the aforementioned range is termed an “opportunity zone” since the risk of a sell-off is less.
At the time of writing, the 365-day MVRV was hovering at around -30% – A perfect accumulation zone for long-term holders. It also seemed to be in line with the technical perspective’s bullish forecasts.


