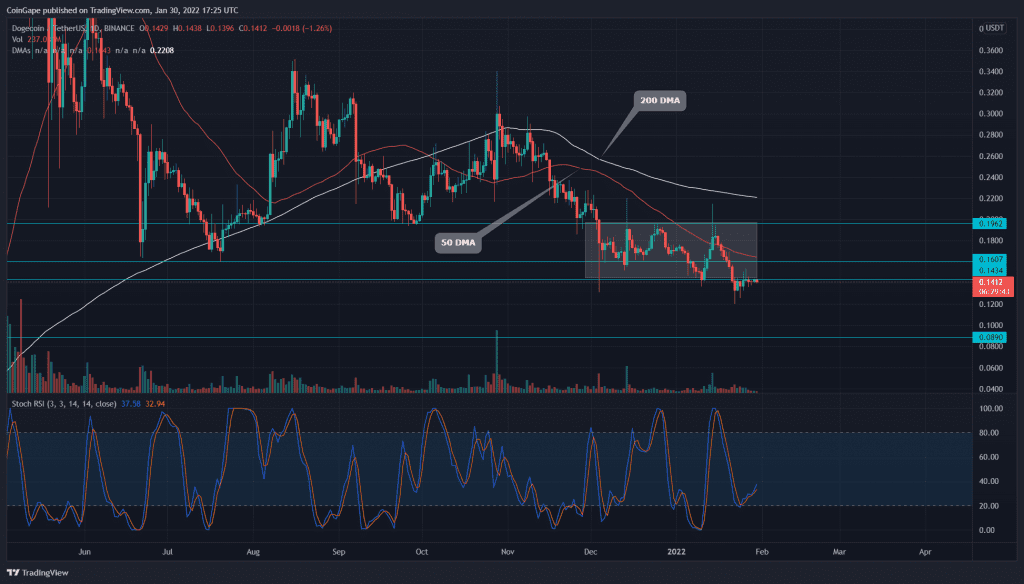
Under the influence of last week’s intense sell-off, the DOGE price gives a bearish breakdown from the extreme support(0.143) of a narrow range. The coin price is currently in a retest phase trying to gather sufficient supply to continue the down rally.
Key technical points:
- The Dogecoin price shows higher price rejection candles at the $0.14 resistance
- The 24-hour trading volume in the Dogecoin coin is $355 Million, indicating a 13.5% loss.
Source-Tradingview
In our previous coverage on Dogecoin technical analysis, Coingape warned regarding the 15% fall, if the bears knock out the $0.16 support. However, with a swift sell-off during last week’s bloodbath, the bulls lost an even lower support level of $0.143.
For almost two months, the DOGE price was resonating in a confined range, stretching from $0.195 to $0.143. With the recent nosedive below the bottom support, the technical chart shows the next support mark directly at the $0.09 mark.
The DOGE price chart displays a bearish alignment among the crucial DMA levels(20, 50, 100, and 200). These DMA levels would act as valid resistance during possible bullish reversal.
The daily Stochastic RSI despite giving a bullish crossover of the K and D line struggles to keep up the upside rally.
The DOGE Price Experiencing Supply Pressure Above $0.14 Mark

Source- Tradingview
The DOGE price is currently resting the new flipped resistance of $0.14. The buyers struggling to surpass this overhead resistance indicates the intense supply pressure from above. If the bears continue to exert selling pressure, the DOGE price would drop another 35%
The Moving Average Convergence Divergence lines waver around the neutral zone indicating no clear control from either of the parties. However, following the bearish breakdown, the MACD and signal line would sink to the bearish territory.
- Resistance levels- $0.143 and $0.16
- Support levels- $0.12 and $0.0.9


