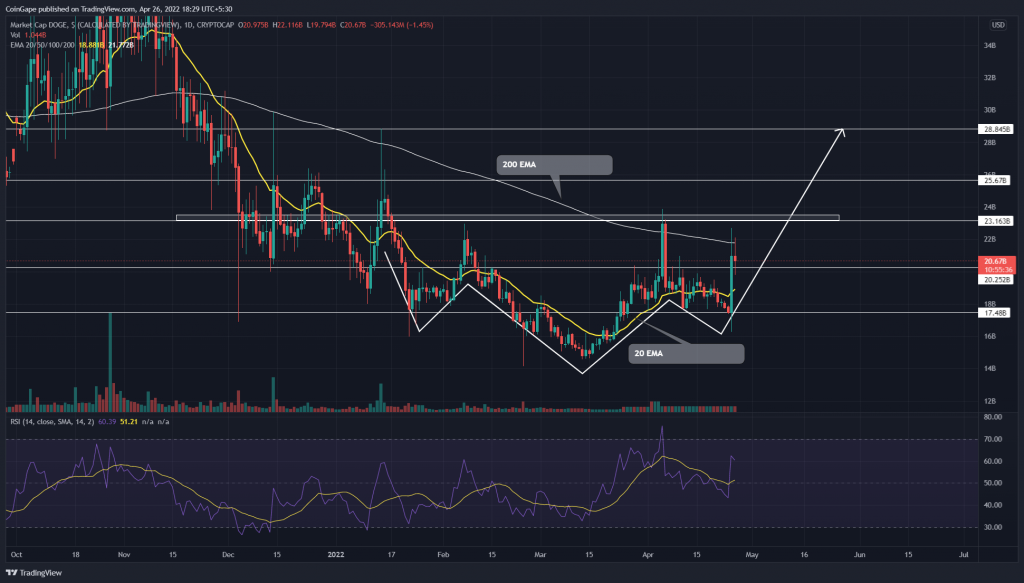
On April 25th, the Dogecoin(DOGE) price rebounded from the $17.5 support with a long bullish engulfing candle. The buyers knocked a local resistance of $20.2, aiming for a 14.4% higher level of $21.3. A follow-up breakout would trigger the inverted H&S pattern to bolster further recovery.
Key points:
- The DOGE price is facing strong resistance from the 200-day EMA
- The 24-hour trading volume in the Dogecoin coin is $6.5 Billion, indicating a 300% gain.
Source-Tradingview
The Dogecoin(DOGE) price stabilized after a 24.3% correction in the past three weeks. The coin price lowered in a falling wedge pattern and an upside breakout from its trendline, releasing the trapped bullish momentum.
Anyhow, the breakout candle projected a 20% intraday growth and has engulfed the past eighteen days of price action. This massive pump must be responding to the fact that Elon Musk bought Twitter for a deal of about $44 billion.
The recovery rally has breached the $20 physiological level, and post retest rally should push the price to $23.16 resistance. Furthermore, the coin chart displays the formation of an inverted head and shoulder pattern, indicating a strong bullish set-up to lead to further recovery.
Trending Stories
If buyers give an honest breakout from the $23.16 neckline, the altcoin could rise 11% higher to hit $25.6, followed by $28.8.
advertisement
Technical indicator
Despite a strong momentum rally, the DOGE price struggles to surpass the 200-day EMA. The coin chart displays long-wick rejection, suggesting the sellers are aggressive on the higher levels. On the flip side, the recent price jump has regained the 20, 50, and 100 EMAs, which may assist buyers in carrying the bull run longer.
The RSI slope made a robust entry into the bullish territory, with its current value at 63%. The sudden spike reflects a strong bullish momentum.
- Resistance levels- $23.1 and $25.6
- Support levels- $20.2 and $17.4


