Published 54 mins ago
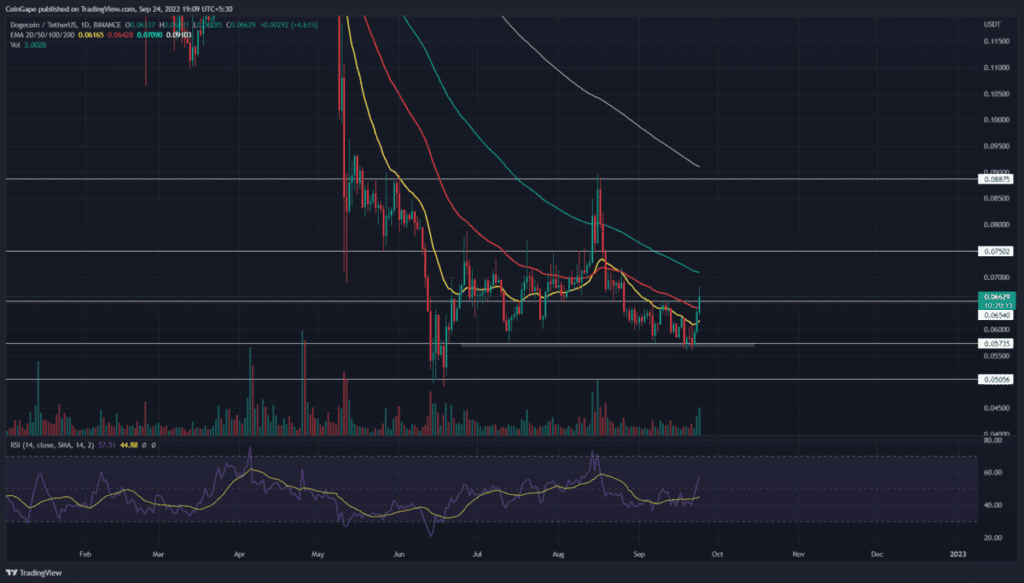
The Dogecoin(DOGE) shows a high momentum V-shaped recovery from the $0.057 monthly support. The three days winning streak with sufficient volume indicates strong bullish momentum. Moreover, the prices have recently breached the $0.065 resistance providing an entry opportunity for interested traders.
advertisement
Key points:
- The potential buyers should for the daily candle to close above $0.065.
- The daily-RSI slope re-enters the bullish territory.
- The 24-hour trading volume in the Dogecoin coin is $302.8 Million, indicating a 16.5% gain.

Source-Tradingview
The recent correction in Dogecoin price evaporated around 78.6% gains from the June-August recovery. The downfall itself registered a 35.5% loss and plunged to the $0.05716 mark. However, such a long correction indicated weak bullish momentum and lessened the possibility of price recovery.
However, the altcoin obtained sufficient support at this $0.0571 mark, and even after multiple breakdowns attempts, the buyers managed to sustain above it.
Trending Stories
On September 22nd, the dogecoin bounced back from this support with a long bullish candle. The bullish momentum sustained and showed three consecutive green candles, registering 16.7% growth. The bull run breached a local resistance of $0.065 and currently trades at the $0.066 mark.
However, a high wick rejection in today’s candle reflects short-term traders having started booking their profits. Therefore, A daily candlestick closing above this $0.065 mark is important to confirm a bullish breakout.
Doing so will offer a higher footing for buyers to prolong this recovery. Thus, a post-retest rally may drive the prices 14% high to hit $0.075 resistance.
On a contrary note, if the sellers pull the prices below the $0.065 level, the coin holders could experience a minor consolidation.
Technical indicator
RSI indicator: the daily-RSI slope showed an evident bullish divergence at $0.067 support, indicating growth in underlying buying momentum. Moreover, the crossover above midline(50%) reflects the improved market sentiment.
advertisement
EMAs: the recent price jump has reclaimed the 20-and-50-days EMA barrier. Any possible retracement could obtain significant support from these EMA’s.
- Resistance levels- $0.075 and $0.088
- Support levels- $0.065 and $0.057
Share this article on:
The presented content may include the personal opinion of the author and is subject to market condition. Do your market research before investing in cryptocurrencies. The author or the publication does not hold any responsibility for your personal financial loss.


