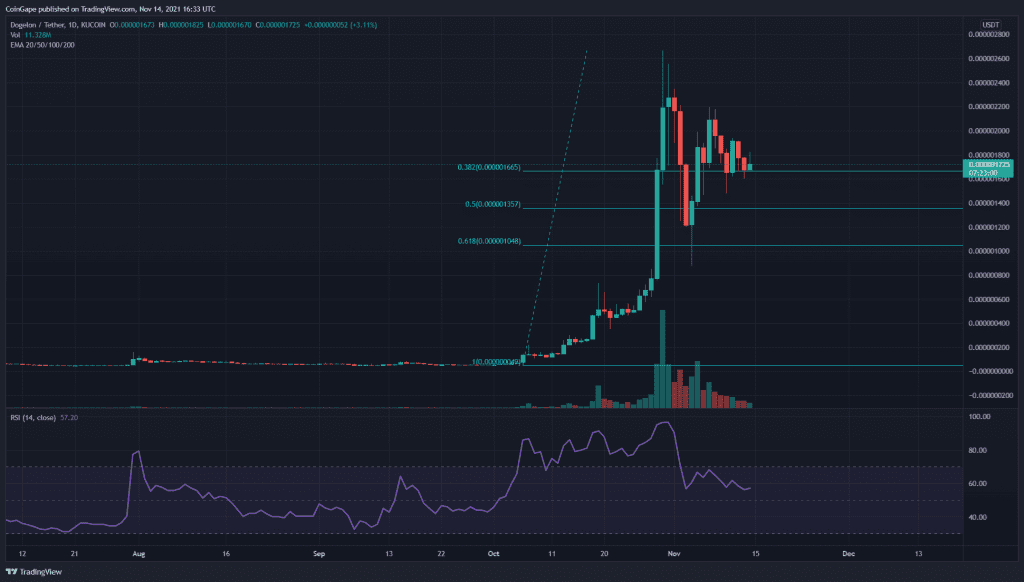
The star of October crypto rally ELON token, which surged around 4000%, is currently in a consolidation phase. The technical outlook for ELON/USD still indicates a bullish trend as the coin is trying to sustain these higher levels. Watch out for these supports levels that can help the token to maintain this rally
- The ELON token price trying to hold above the 0.382 Fibonacci retracement level
- The ELON token’s daily RSI showed a striking drop in its value
- The intraday trading volume in the ELON token is $60.8 Million, indicating an a4.72% gain.
Source- ELON/USD chart by Tradingview
The ELON token showed an incredible rally in October, where the price gained more than 4000% from the month’s low. The token made a New All-Time High at the $0.00002675 mark and then entered a retracement phase.
This moderate pullback managed to sustain above the 0.618 Fibonacci level and is showed a decent recovery in its technical chart. Moreover, the 20 EMA line is also providing strong support to the ELON token price.
The Relative Strength Index value at 57 indicates a bullish sentiment still intact for the ELON token. However, the RSI line displayed a considerable drop in its value for a minor retracement phase, suggesting weakness in this rally.
ELON/USD Chart In The 4-hour Time Frame

Source- ELON/USD chart by Tradingview
The ELON token in this lower time frame chart suggests a possibility of forming a bearish head and shoulder pattern, indicating a great sell opportunity for crypto traders. The current price of this coin is at the $0.0000017 mark, with an intraday gain of 1.61%
The neckline for the pattern is present at the $0.000001475 mark, and the crypto should wait for a decisive breakdown from this support level before they take a new position in the crypto market.
.


