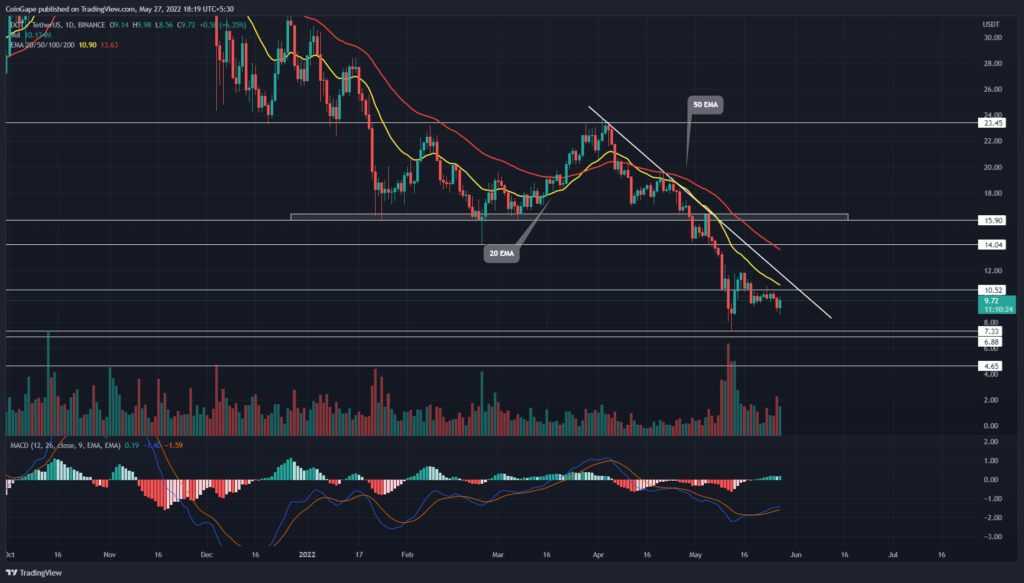
The ongoing correction phase in Polkadot(DOT) price takes a breather at the $7.35 mark and triggers a minor consolidation. Therefore, an extra force is needed for the price to escape this unwavering movement, which can be provided with the downsloping trendline.
Key points:
- The DOT chart showcase four consecutive red candles on the weekly time frame chart
- The descending trendline may bolster the continuation of the ongoing downfall
- The 24-hour trading volume in the Polkadot coin is $1.35 Billion, indicating a 87% gain.
Source-Tradingview
On April 30th, the DOT sellers breached the $16 bottom support of a three-month-old consolidation range. The replenished selling momentum combined with the early May sell-off sank the coin price to a $7.34 low.
From the last swing high of $23.5, the downfall records a 69% loss. However, for nearly three weeks, the DOT price has witnessed a sideways rally suggesting uncertainty among the market participants.
This two-month downfall has responded to a descending trendline providing excellent short-selling opportunities for interested traders. Additionally, as the coin prices lateral walk nearing the resistance trendline, the traders may experience additional selling pressure.
Trending Stories
The possible reversal could slump the DOT price to $7.34 support or even lower.
advertisement
On the flip side, if the DOT price could breach the dynamic resistance trendline, the buyers could drive the price 142% higher to $23.5.
Technical Analysis
Following a bullish crossover, the MACD and signal line rising reflects growth in bullish momentum. Furthermore, these rallying slopes hold additional confirmation for the buyers if they breach the neutral zone(0.00)
However, the 20-day EMA offers dynamic resistance to the DOT price, similar to the descending trendline. Moreover, the 50-and-100-day EMA aligned with $15 and $16 levels, respectively, may try to stall the expected rally
- Resistance levels- $10 and $12
- Support levels- $7 and $4.6


