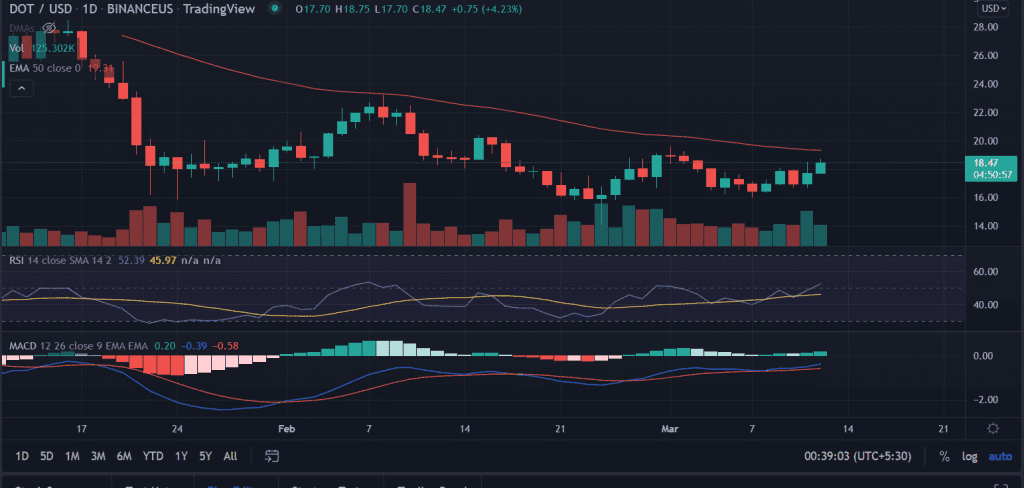
DOT price edges higher with significant gains on Saturday. The price opened higher and recovered quickly to test the session’s high at $18.69. However, trading volume is supportive of the current price action with more than 10% gains.
- DOT price extends the previous session gains on Saturday.
- More gains if gives closes above 50-day EMA at $19.42.
- The price might shoot toward the ultimate target of $22.0.
As of press time, DOT/USD is trading at $18.58, with 4.85% for the day.
DOT continues to move north
On the daily chart, DOT price is making higher highs after witnessing record lows of $14.06. The price surged 45% to the swing highs of $19.57, and retrace to the recent lows around $16.01.
DOT price must face and be pierced above the 50-day EMA (Exponential Moving Average) at $19.32 to meet the first upside target of the psychological level at $20.0.
Investors should keep up the buying momentum to fuel the upside rally. Next, the market participants will revisit the highs made on $23.21 on February 8 at $23.21.
Alternatively, if the price slips below the session’s level with a spike in sell order then sellers will collect the liquidity near lows of March 7 at $16.01.
DOT is in a continuous downtrend since made record highs in December and depreciates nearly 65% in February. Investors should flip the crucial $18.50 level to sustain the upside momentum.
Technical Indicators:
RSI: The daily relative strength index crossed above the average line since February 24 and continued to move higher. Currently, it reads at 51 with a positive bias.
MACD: The Moving Average Convergence Divergence hovers below the midline but with a bullish tilt. More buying opportunities will occur if cross above the central line.


