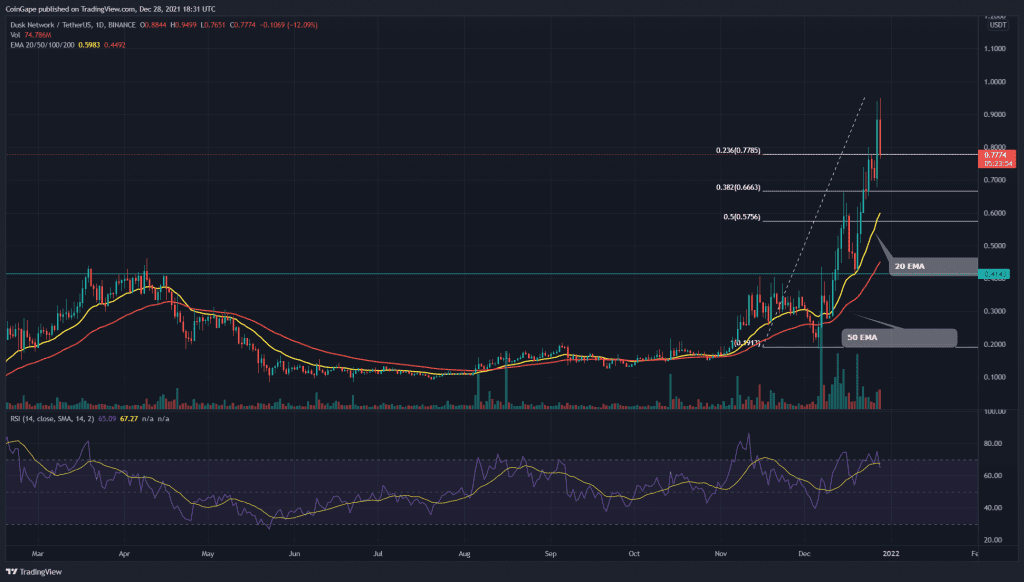
The Dusk Network token had an incredible rally from early December, which marked ATH of $1.5. The pair faced intense selling from the new resistance, starting a minor correction phase. So far, the token has lost nearly 12% from the top and now retest the 0.236 FIB support for continuing its uptrend.
Key technical points to ponder
- The DUSK token faces strong resistance from 50-day EMA support
- The intraday trading volume in the Dusk Network token is $140.3 Million, indicating a 0.84% loss.
Source-Tradingview
As mentioned in my previous article on Dusk Network, the token price gave a decisive breakout from the $0.41 neckline of a cup and handle pattern of the daily time frame chart. The token spent three days in a retest, and later a 30% bullish follow-up candle confirms this breakout.
Since then, the rally continued, and the chart shows new higher highs and higher lows in the daily time frame chart. Today, the pair made a New All-Time High of $0.951, indicating a total gain of 130% from the breakout point.
The DUSK price is trading high above the fast 20 MEA line, projecting a strong bullish trend. The crypto traders can expect good support from the bottom EMA levels in case of occasional pullbacks.
Despite being in the bullish zone, the Relative Strength Index(66) line shows a bearish divergence in its chart.
DUSK token 4-hour Time Frame Chart

Source-Tradingview
After rejecting from the new resistance level of $49.5 level, the token price entered another correction phase. The DUSK price is trading at $0.798, with an intraday loss of 10%. The pair is currently trying to sustain above the 0.236 Fibonacci retracement level.
The important levels for the token on the upside are at $l80, followed by the $1.71. And, on the lower side, the support levels are at $1.5 and $1.38.


