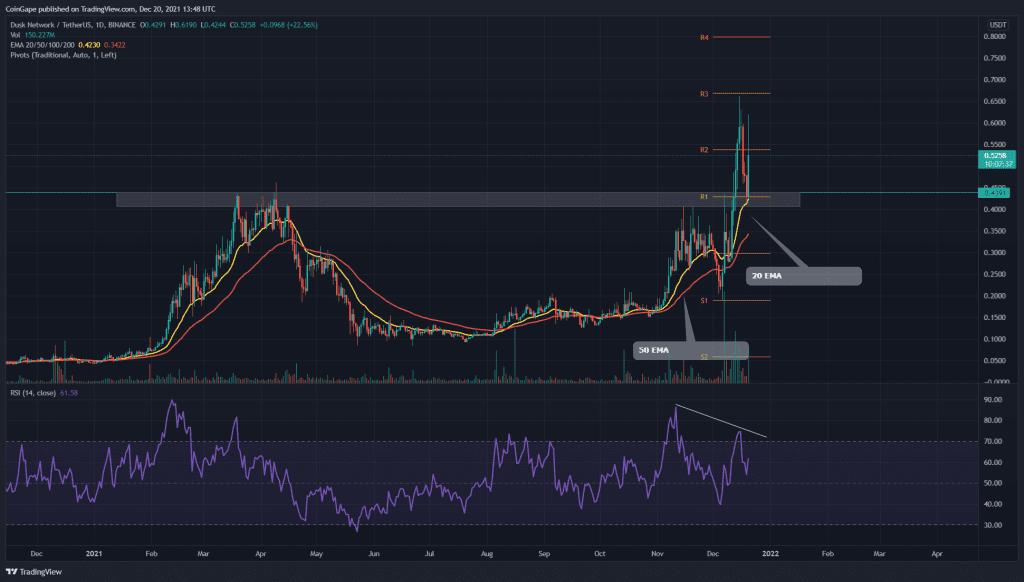
The DUSK/USD technical chart projects an overall uptrend for this token. On December 13th, the token price breached the $0.43 neckline of a daily cup and handle pattern, indicating high potential for the DUSK token.
DUSK/USD Daily Time Frame Chart
Source- Tradingview
Past Performance or Trend-
The DUSK token shows a Cup and Handle pattern formation in the daily time frame chart. The patterns indicated its neckline at the $0.44-0.4 mark, and on December 13th, the price provided a decisive breakout from this level, providing an excellent long opportunity for crypto traders.
4-hour Evening Star Candle Brings Slight Threat To Bullish Rally
After a successful breakout, the DUSK token price rallied and marked a New All-Time High at $0.662. The pair retraced back to retest the new support and check for sufficient demand pressure. Today, the token provided a massive bullish engulfing candle of around 30-25%, suggesting the price has completed the bullish price pattern.
However, the chart still shows a 15% higher price rejection concerning daily candle activity, suggesting slight selling pressure from above. Anyhow, the crypto trader can maintain a bullish sentiment until the price sustains above the $0.4 support.
By the time of writing this article, the DUSK token price is $0.535, with an intraday gain of 25%. The 24hr volume change is $137.2 Million, indicating a 616.5% hike. As per the coinmarketcap, the tokens stand at 200th rank with its current market cap of $198,100,4441(+15.24).
Technical Indicators-
-The daily Relative Strength Index(61) showed bearish divergence in the chart, suggesting some weakness in this bullish rally
-The DUSK token indicates a bullish alignment of the crucial EMAs(20, 50, 100, and 200). Moreover, the 20 EMA line provides strong support to the token price
-As per the traditional pivot levels, the token traders can expect the nearest resistance for the DUSK price at $0.54, followed by $0.668. As for the flip side, the support levels are $0.427 and $0.3.


