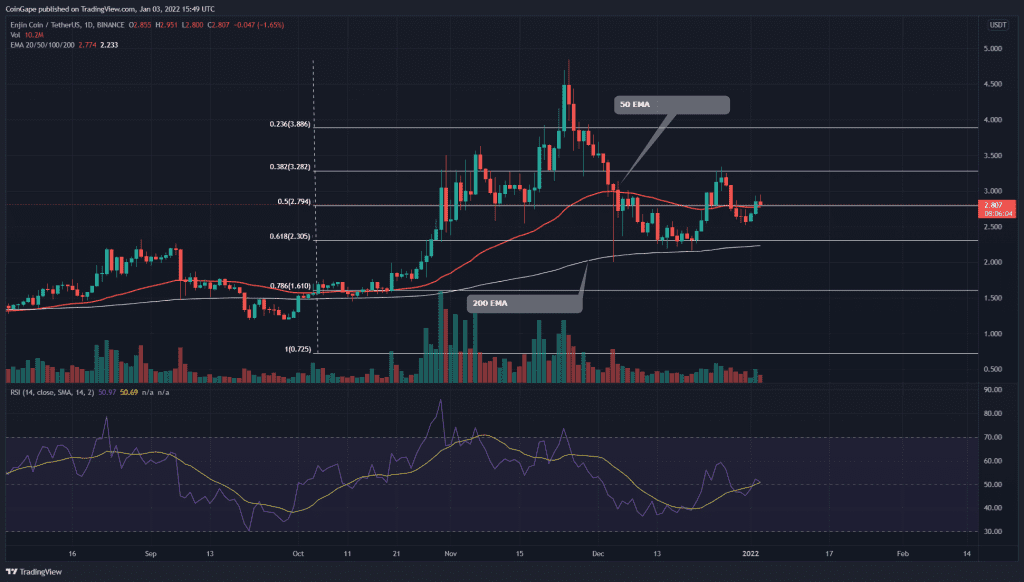
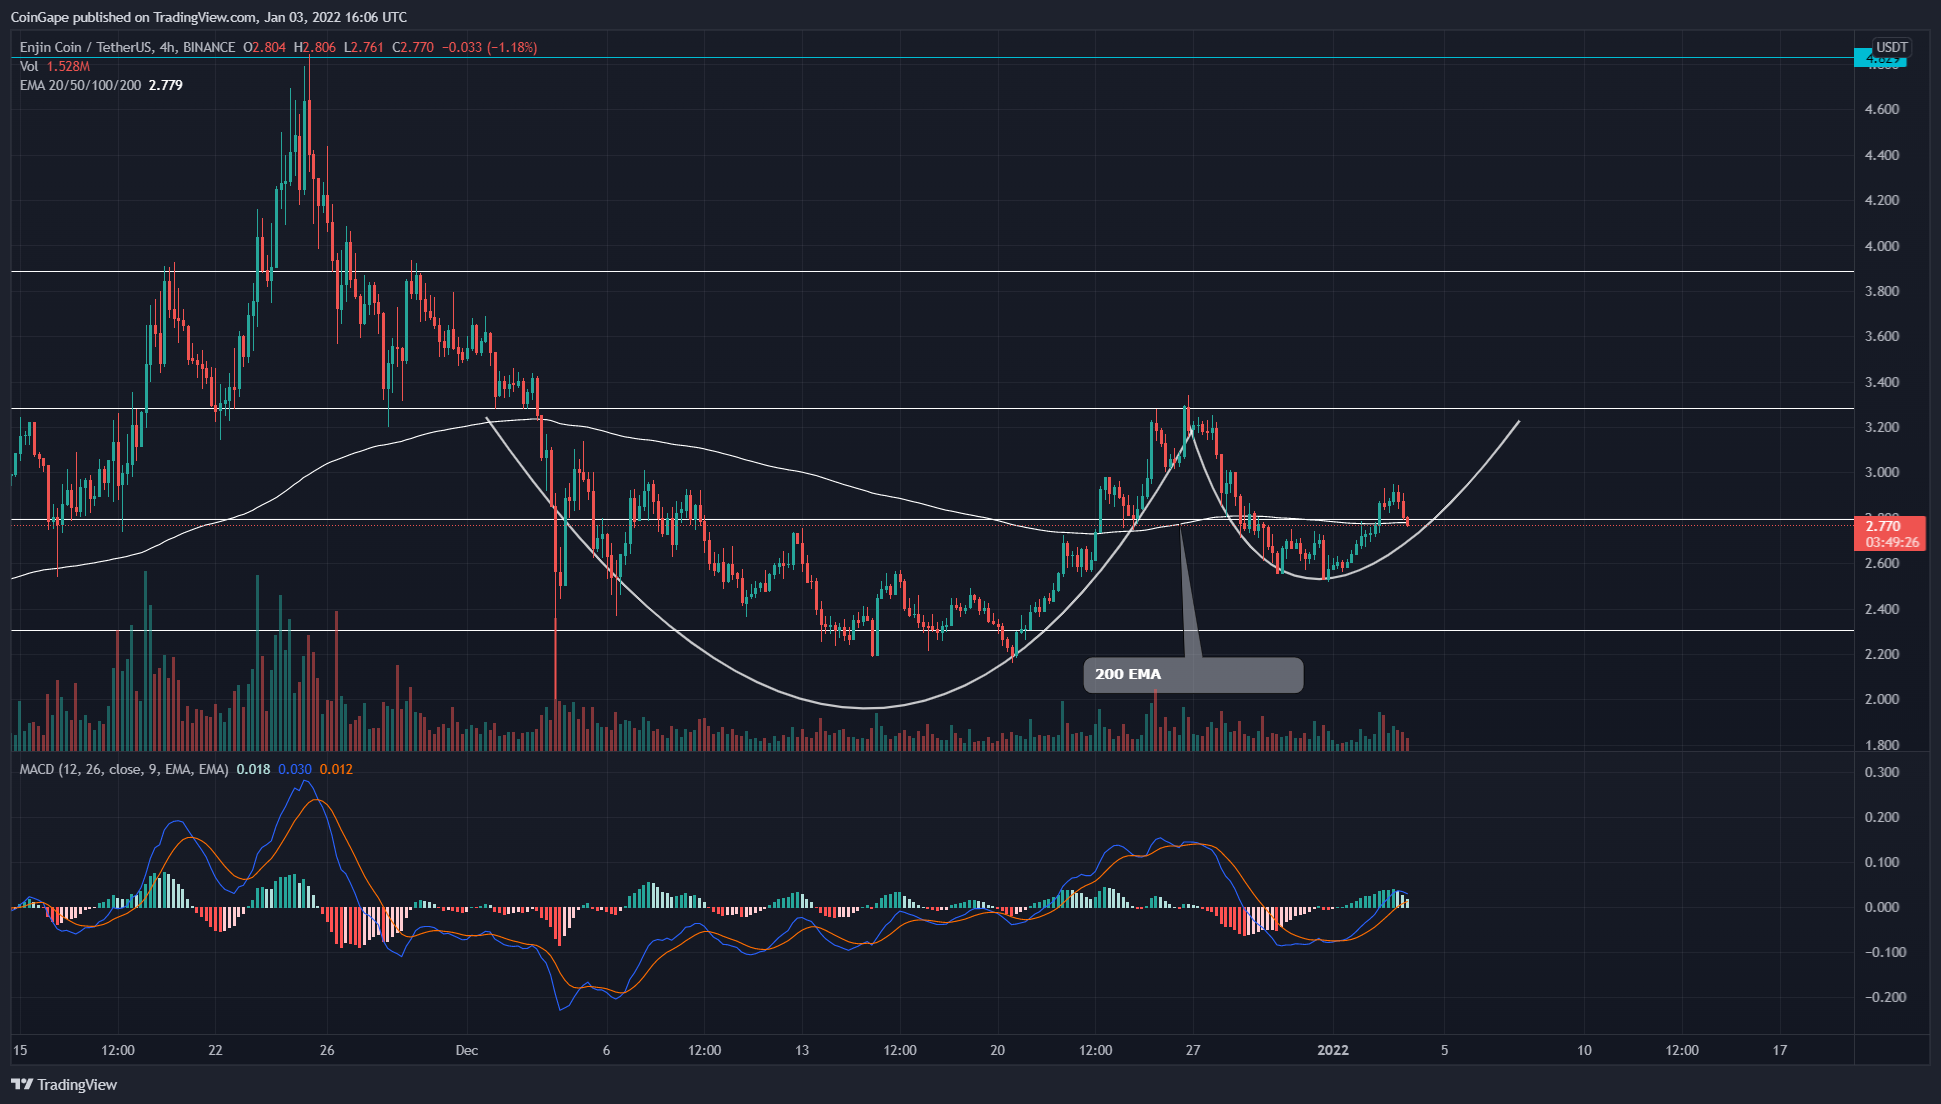
The ENJ coin nearly lost half of its value in the recent price correction, which plunged the coin to the $2.2 mark. A confluence of major technical levels 0.618 Fibonacci retracement level and 200-day EMA provided sufficient support to the price to initiate a recovery rally. Moreover, the price is growing in a cup and handle, which would add to the underlying bullishness of the coin.
ENJ Key technical points:
- The ENJ coin price crossed above the 20-and-50 EMA together
- The 24-hour trading volume in the Enjin coin is $358.8 Million, indicating a 72.5% gain.
Source-Tradingview
Previously when we covered an article on the Enjin coin, its price resonated in a falling wedge pattern. As suspected, the pattern provided an excellent long opportunity when the price breached its overhead resistance trendline.
The coin gained 39% from this pattern and reached the $3.2 resistance. However, the supply pressure at this level triggered another pullback for this coin, dropping the price back to $2.5 support.
The buyers are trying to recover again and have recently knocked out a minor resistance level of $2.8 resistance. The price also reclaimed the bullish sequence among the crucial EMAs(20, 50, 100, and 200).
The daily Relative Strength Index (51) enters the bullish territory. Moreover, with the recent pump, its line has also crossed above the 20-SMA.
ENJ Coin Struggles To Sustain Above 200 EMA Of 4-hour Chart
Source- Tradingview
This Enjin coin price reveals a cup and handles pattern in the 4-hour time frame chart. The price is now forming the handle portion of this pattern. The crypto traders should wait until the price breaks out from the $3.3 neckline, providing another long trade that could reach the $4 mark.
The technical chart indicates the important resistance levels are $3.3 and $3.8. Moreover, the support levels are $2.83 and $2.2.
The Moving average convergence divergence shows both the signal and MACD line are on the verge of crossing above the neutral level(0.00). This crossover should provide extra confirmation for long traders.


