Enjin Coin (ENJ) is showing bullish signs just above a crucial support area. This could lead to an eventual breakout.
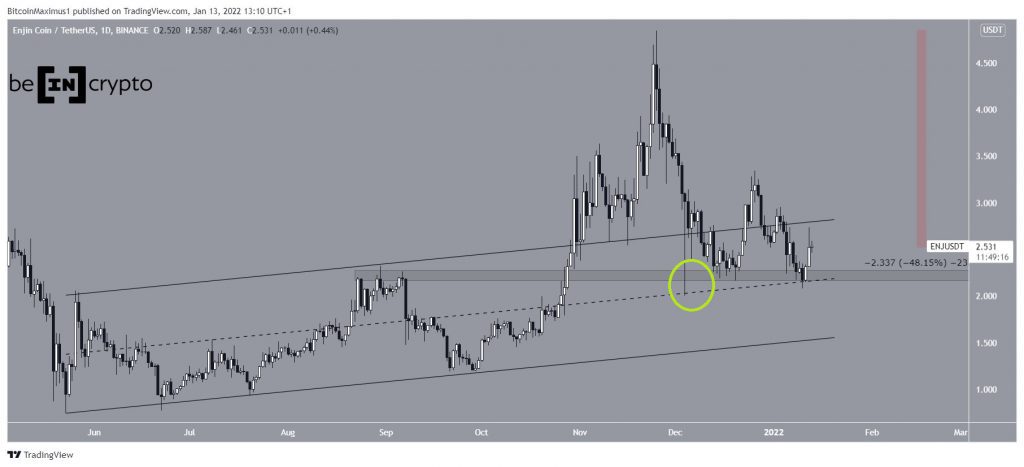
ENJ has been falling since reaching an all-time high price of $4.84 on Nov 25. So far, it has decreased by 48%.
On Dec 4, the token bounced at the $2.25 horizontal support area (green circle). This created a long lower wick, which is considered a sign of buying pressure. The bounce served to validate both the $2.25 area and the middle of an ascending parallel channel, inside with ENJ previously traded.
Therefore, it is a crucial support area. A breakdown below it could indicate that the trend is bearish.
Future movement
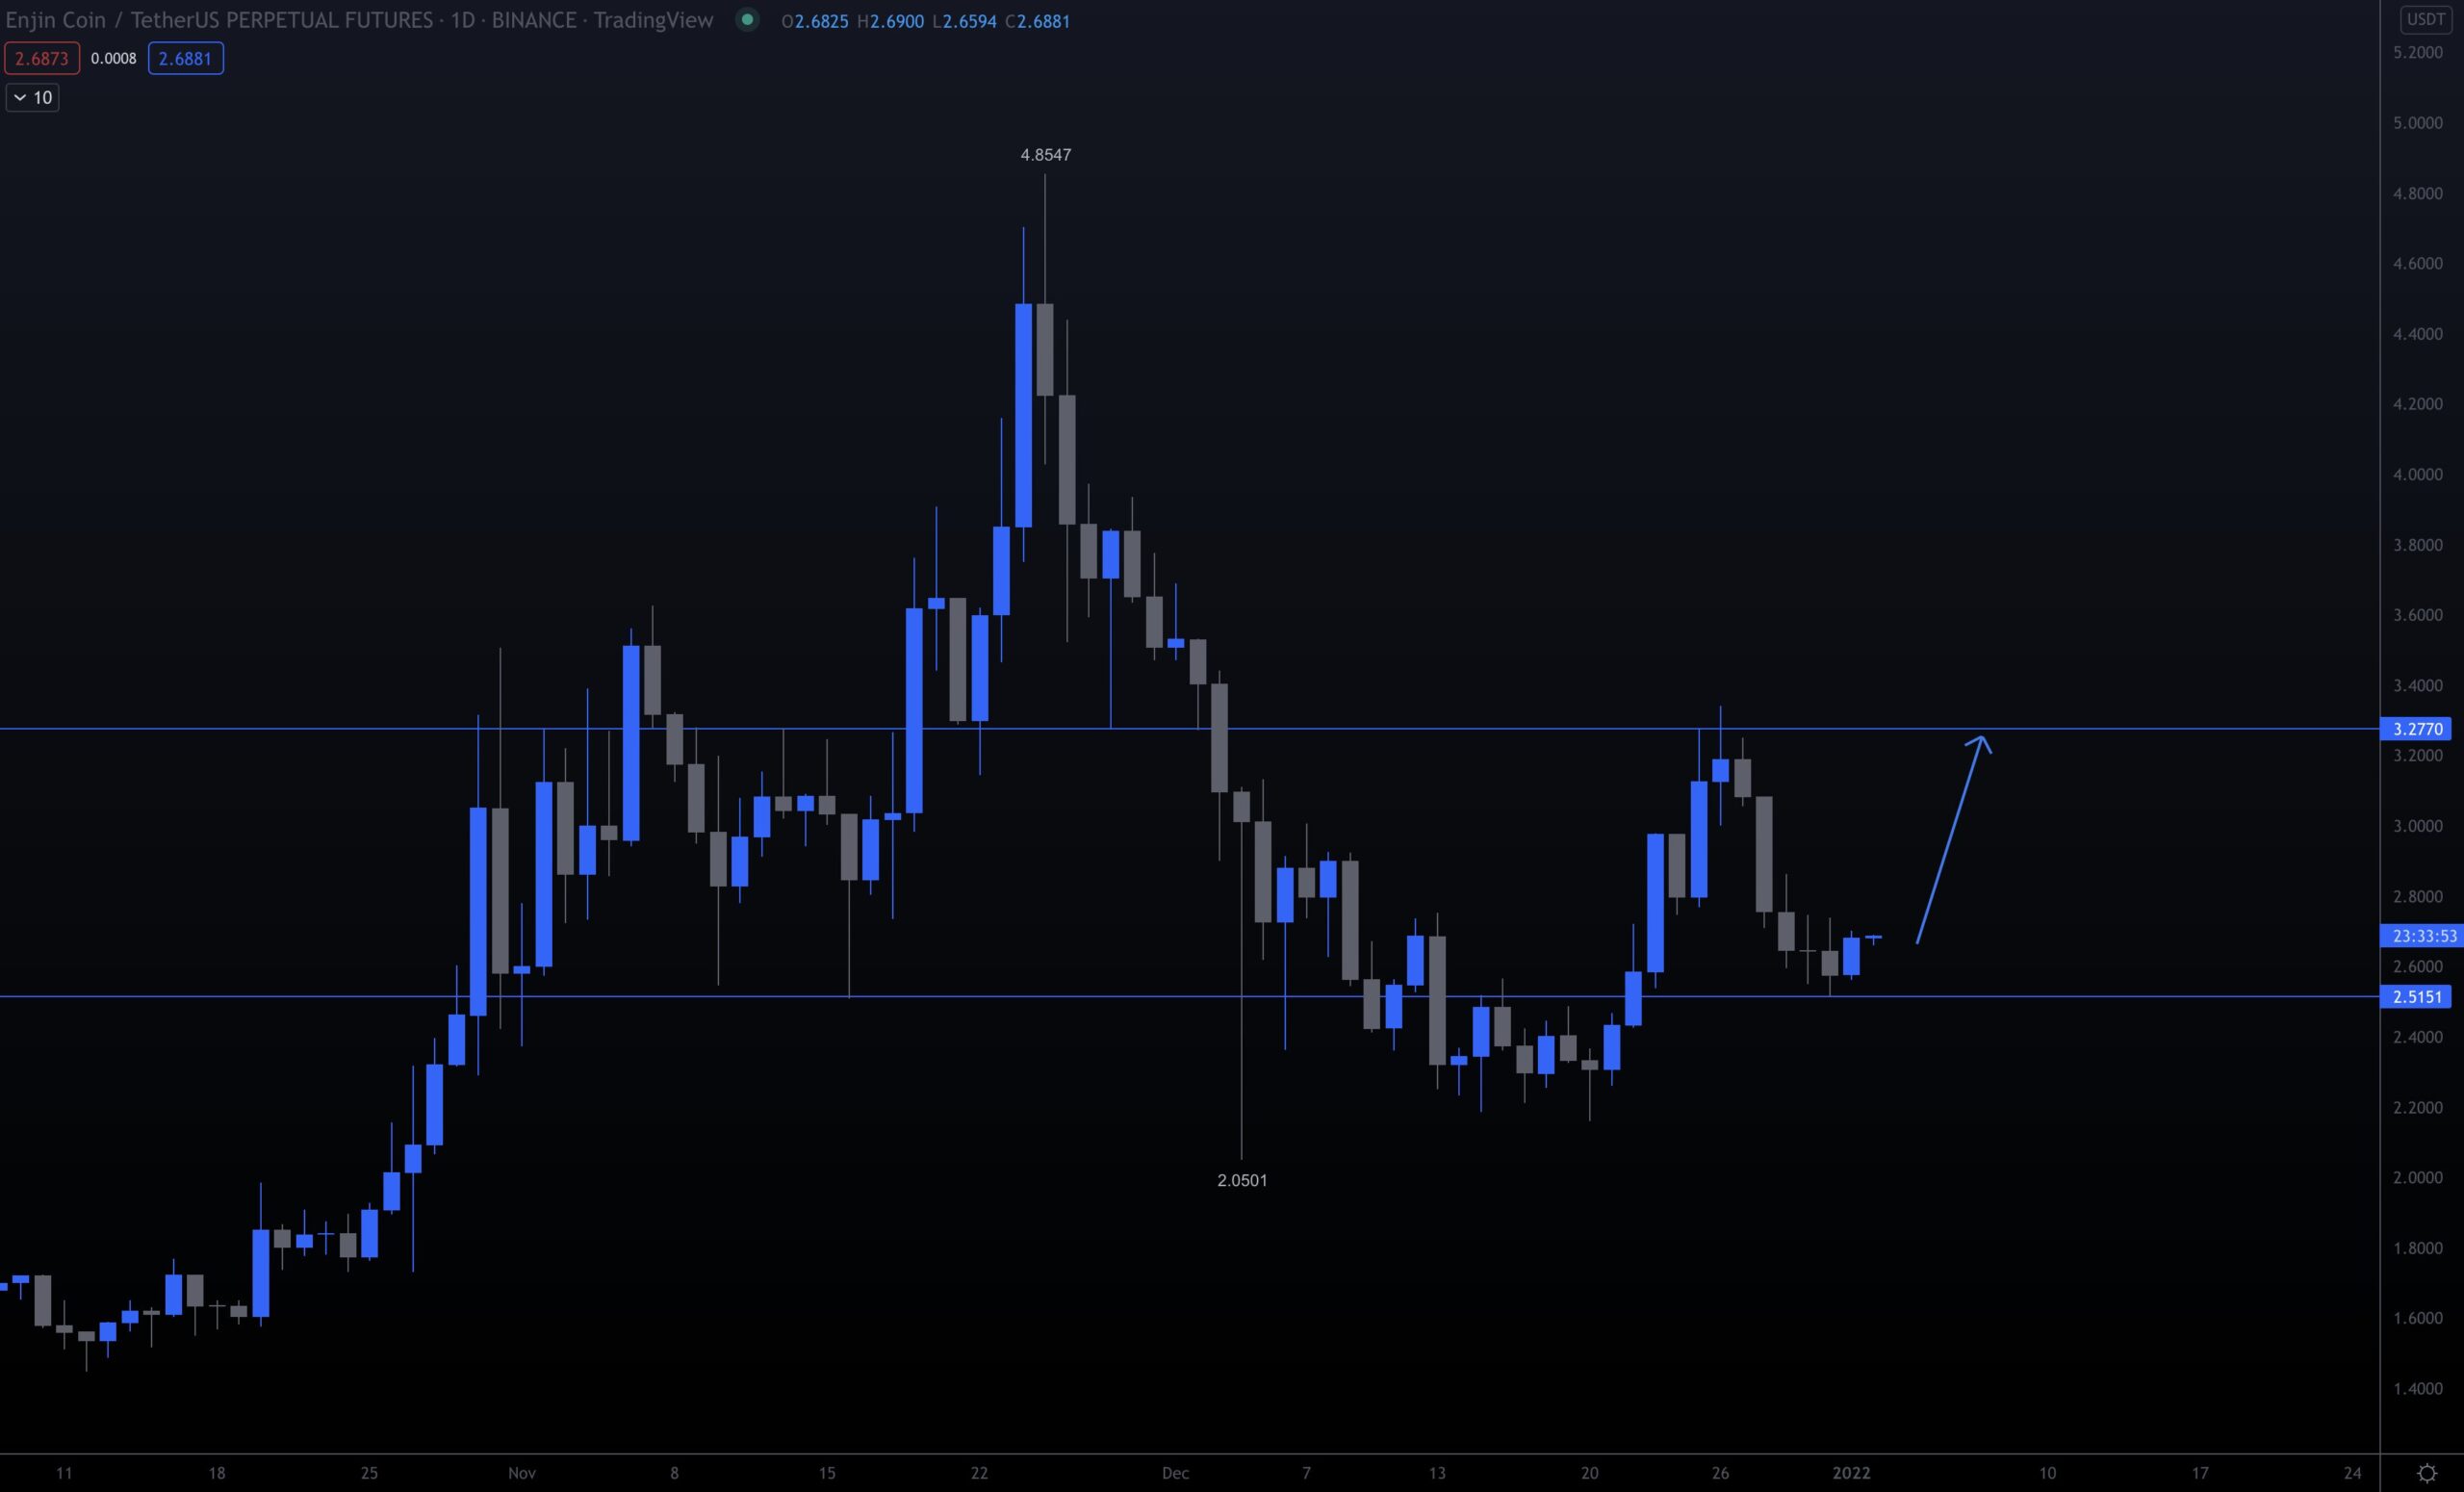
Cryptocurrency trader @TradingTank tweeted an ENJ chart, stating that the token is likely to increase towards $3.2.

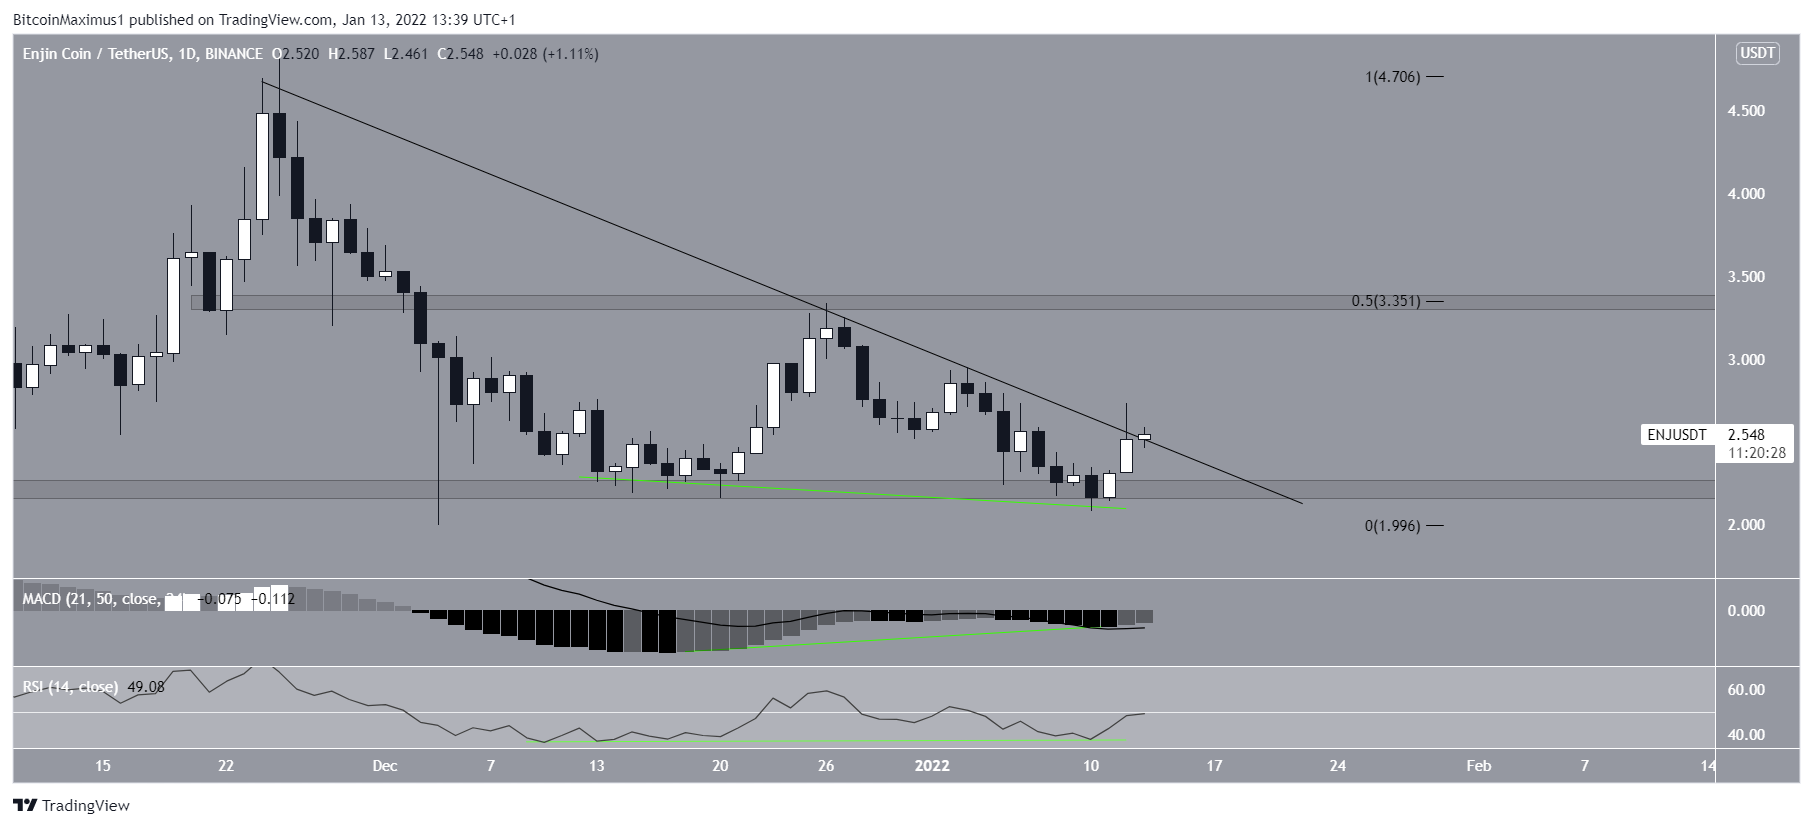
Technical indicators in the daily time-frame are showing bullish signs. This is especially visible by the considerable bullish divergence (green line) that has developed in both the RSI and MACD. This is a sign that often precedes bullish trend reversals.
However, an RSI movement above 50 and a MACD movement into positive territory would be required in order to confirm the trend reversal.
If a breakout occurs, the closest resistance area would be at $3.35. This is a horizontal resistance area and the 0.5 Fib retracement resistance level.

ENJ/BTC
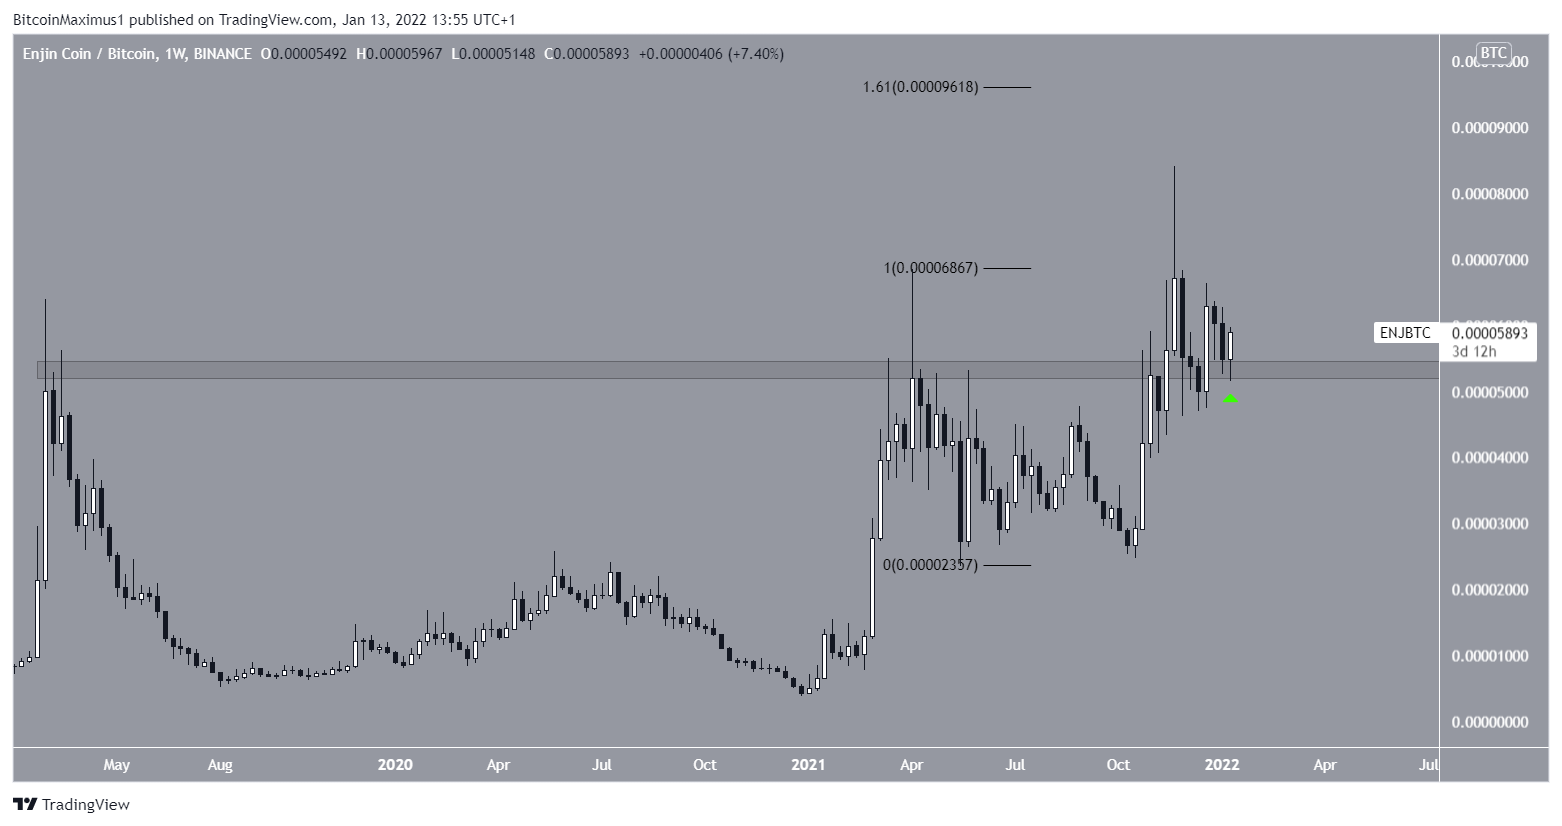
The ENJ/BTC chart is decisively bullish. The token has broken out above the 5200 satoshi area, which had previously acted as the all-time high resistance.
Currently, it is in the process of validating this area as support (green icon). Doing so would allow for an upward movement towards a new all-time high and into price discovery.
If one occurs, the closest resistance area would be at 9600 satoshis, created by the 1.61 external Fib retracement level when measuring the most recent drop.

For BeInCrypto’s latest Bitcoin (BTC) analysis, click here.
Disclaimer
All the information contained on our website is published in good faith and for general information purposes only. Any action the reader takes upon the information found on our website is strictly at their own risk.


