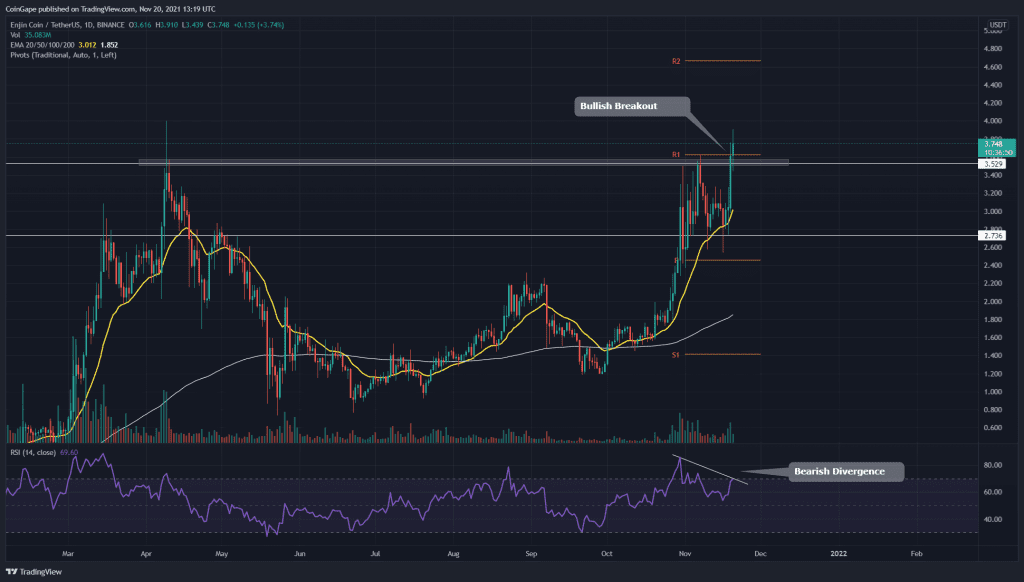
The ENJ token presented an impressive recovery from its minor retracement phase. The token surged around 50% from this week’s low and has also breached the All-Time High Resistance of $3.53. The token price sustaining above this resistance should initiate a strong rally in ENJ.
Key technical points:
- The ENJ token price action forms a Cup and Handle in the daily time frame chart.
- The daily RSI chart shows a significant divergence bearish for ENJ price.
- The intraday trading volume in the ENJ token is $1.6 Billion, indicating a 51.4% hike.
Source- ENJ/USD chart by Tradingview
The ENJ token indicated an excellent opportunity for its traders by forming a Cup and Handle pattern in the daily time frame chart. The neckline of this pattern was also the ATH resistance level, i.e., $3.53. And on November 19th, the token provided a deceive breakout from this overhead resistance, triggering an entry signal for these traders.
The crucial EMAs(20, 50, 100, and 200) show the strong bullish alignment for the ENJ token. Moreover, the 20 EMA line provides strong support to the token price.
The Relative Strength Index value at 69 suggests the token maintains a bullish sentiment. However, the RSI shows a considerable bearish divergence in its chart, indicating doubts for this bullish rally.
ENJ/USD Chart In The 4-hour Time Frame

Source- ENJ/USD chart by Tradingview
The ENJ token price retraced back to the $3.53 neckline to check for proper support. The chart displayed a 4-hour bullish engulfing candle indicating strong bullish momentum in this token. However, the bearish divergence in RSI cannot be ignored, and therefore, the crypto traders should follow strict risk management if they enter with a long trade.
According to the daily-traditional pivot levels, the nearest resistance for this token would be at $4.66 and later $5.85.


