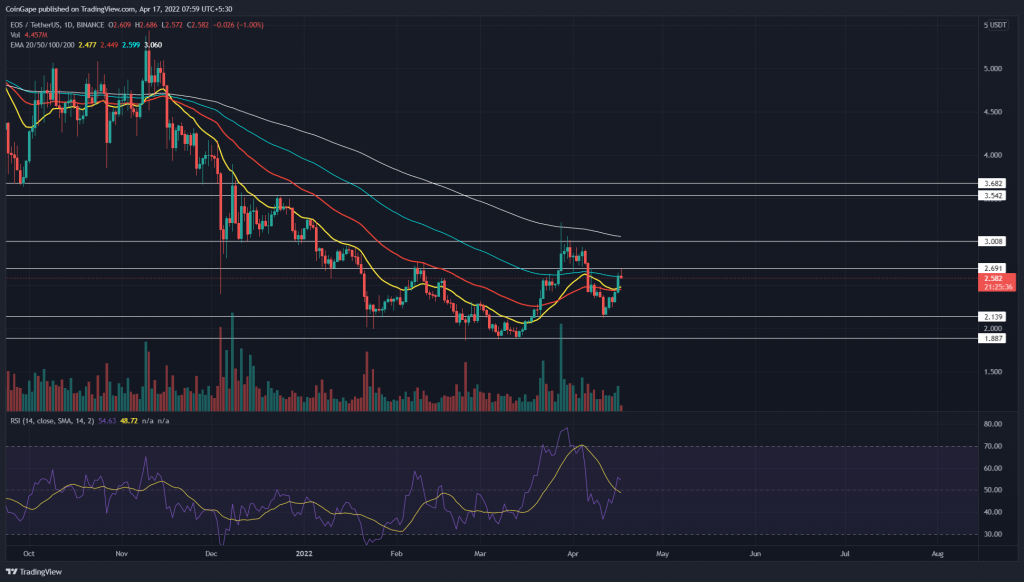
The recent correction phase discounted the EOS price by 28% and dumped it to $2.12 support. Responding to the falling wedge pattern, the altcoin bounced back from the mentioned support and continued the north march towards the $3 mark. Can buyers trigger the wedge pattern to bolster a bullish rally?
Key points:
- The EOS price is nearing a $2.7 breakout
- The EOS price has soared 20% in the past six days.
- The intraday trading volume in the EOS is $999 Billion, indicating a 128% gain.
Source- Tradingview
Since last year the EOS/USDT pair has been lowering under the influence of a falling wedge pattern. The recent bull cycle from the support trendline($1.83) pumped the altcoin to the $3 mark; however, amid the current sell-off in the crypto market, the coin price tumbled by 28%.
The EOS price rebounded from the $2.12 support, indicating traders are buying on dips, and the price is likely to retest the aligned resistance of $3 and descending resistance trendline and 200-day EMA.
For EOS holders: Traders should keep a close eye on the $3 resistance as the potential rally could breach the descending trendline and 200-day EMA.
Trending Stories
A bullish breakout and sustainability above this resistance would indicate a positive turn in traders’ sentiment, which gives the first target $3.7.
advertisement
Alternatively, a bearish reversal from the $3 resistance would keep the pattern intact with the next bottom target till $1.9.
Technical indicator
RSI– The RSI slope jumps back into the bullish region, indicating the traders are optimistic about a short-term rally.
EMAs– The coin price reclaimed the 20, 50, and 100 EMA undermines the last correction in late March. However, the 200-day EMA aligned with the $3 resistance, strengthening the supply pressure for buyers.
- Resistance levels- $2.7, and $3
- Support levels- $2.14 and $1.8


