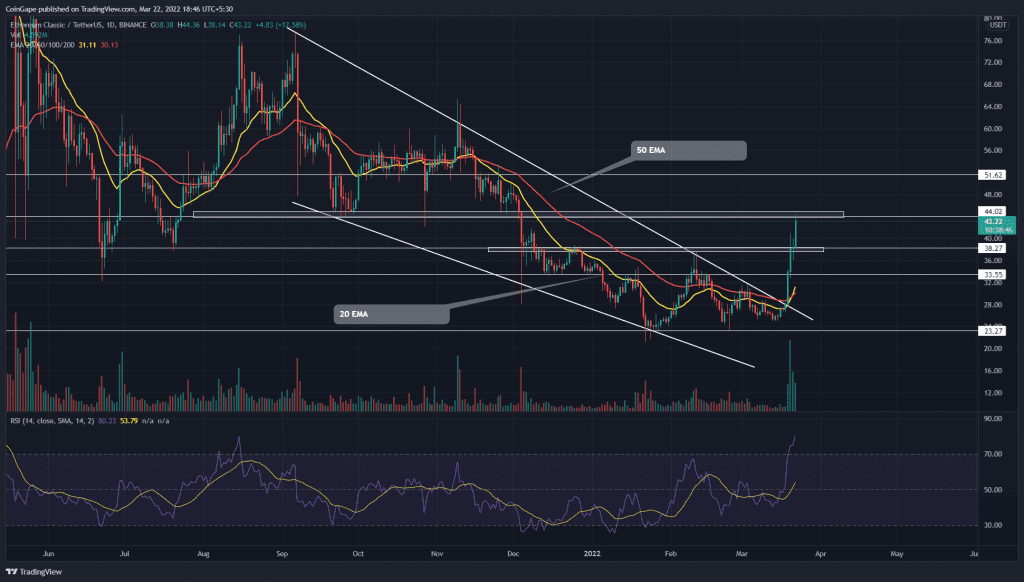
Unlike volatile market leaders Bitcoin and Ethereum, the ETC/USDT pair initiated an upright rally with a 21% long bullish candle piercing through wedge pattern resistance on March 11th. The following day, altcoin soared 10%, and the rally continued till the $44 mark. But, how far can buyers sustain this bullish momentum?
Key points:
- A minor retracement is needed to stabilize the aggressive buying
- The 20-and-50- EMA offers a positive crossover
- The 24-hour trading volume in the Ethereum Classic coin is $2.3 Billion, indicating a 26.9% fall.
Source-Tradingview
A falling wedge pattern carried the recent downtrend in the Ethereum Classic(ETC) price and marked a new lower at $21.25. However, the coin price rebounded from this support twice, indicating a strong accumulation zone for traders.
The price action squeezed between the resistance trendline and $23.2 support resulted in a decisive upside breakout on March 19th. The buyer maintained strong momentum and gathered a 55% gain in the last four days.
Today, the ETC price is up by 13% and retest the $44 monthly resistance. However, the altcoin is expected to provide a minor correction before it could continue the bull run. The technical chart suggests the $38.6 and $33.55 could act as strong pullback support.
Best optionsEarnEarn 20% APRWalletCold WalletEarnEarn 20% APR
Furthermore, a breakout and closing above the $44 mark should open the door $50 psychological level, followed by $60.
On the other hand, the fallout from the $33.5 support could sink the altcoin to $23.3 crucial support.
Technical indicator
In one stroke, the sudden price jump breached the bearishly aligned crucial EMAs(20, 50, 100, and 200). Moreover, the upcurved 20-and-50-day provides a bullish crossover encouraging the ongoing recovery.
The Relative Strength Index(80) indicator shares a similar pump charging straight overbought region with no sign of bearish divergence so far.
- Resistance level: $44 , $50
- Support level: $38.6, $33.5


