Disclaimer: The findings of the following analysis are the sole opinions of the writer and should not be considered investment advice.
- Bearish market structure on higher timeframes
- ETC trades near the Fibonacci golden pocket as well
Ethereum Classic [ETC] saw a lackluster performance in the markets on 15 October. It stood at an important lower timeframe resistance belt but was neither able to advance nor decline by a significant amount.
Here’s AMBCrypto’s Price Prediction for Ethereum Classic [ETC] in 2022
Perhaps this suggested a weekend of lowered volatility for ETC. In that case, 17 October could resolve the issue. However, as things stand, the bears had the upper hand. The boost in hash rate in September saw the price advance rapidly to $40. However, it has only been downhill on the charts since then.
Confluence of bearish factors seen for ETC
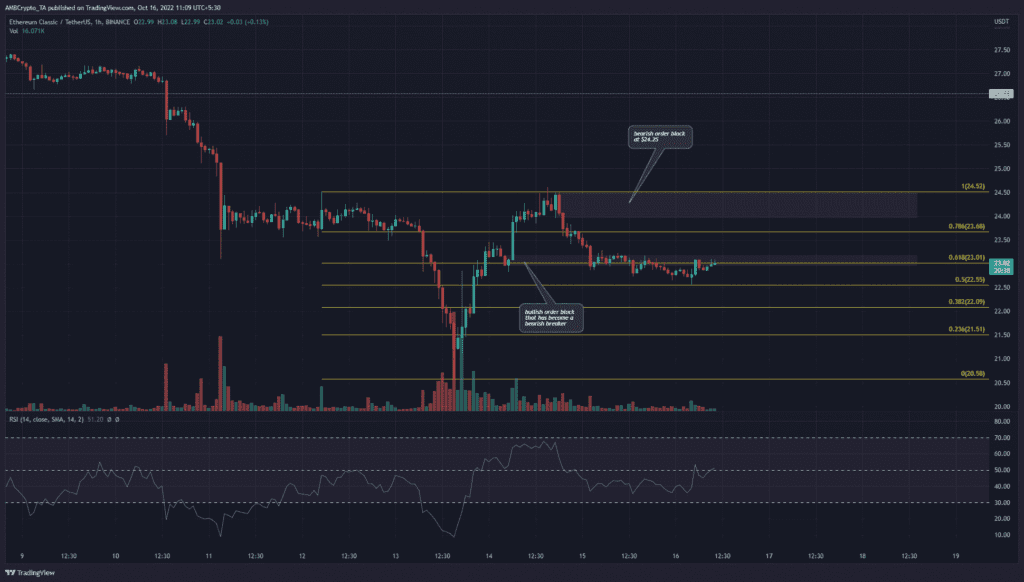
A set of Fibonacci retracement levels were drawn based on ETC’s move from $24.52 to $20.58. They showed the 61.8% and 78.6% retracement levels to lie at $23.01 and $23.68. An examination of the four-hour and daily timeframe charts showed the market structure to be bearish.
Hence, lower timeframe traders can be on the lookout for a bearish setup. And one such seemed to present itself for Ethereum Classic. The golden pocket in the Fibonacci retracement levels had confluence with a bearish breaker in the $23 zone. The Relative Strength Index (RSI) was also beneath the neutral 50 line, and could form a hidden bearish divergence and signal a continuation of the downtrend.
Marked in red, there was a relatively low risk shorting opportunity present for ETC. Invalidation of this idea would be a session close above $23.6. However, further north, a bearish order block was seen in the $24-$24.5 region. Bearish price targets would be each of the Fibonacci retracement levels and they can all be used to take-profit partially and also move stop-loss to break even.
Failure of the current bearish breaker could complicate the scenario, but a short position can also be possible near the $24 zone. Invalidation of that idea would be a session close above $24.52.
OI on the rise- are traders expecting a strong move?
Coinglass data showed Open Interest to be on the rise over the past 24 hours. Yet, during this time, the price stagnated at the $23 resistance. This indicated that futures traders likely positioned themselves expecting a large move.
Long vs Shorts on Coinglass showed 51.7% of market participants to be short over the past 24 hours. Could Ethereum Classic move higher and force these bears to puke, and use the fuel to rise further to $24.5? Or, can the selling pressure prevail and send ETC tumbling? Only time will tell for sure, but the technical findings painted a bearish picture.


