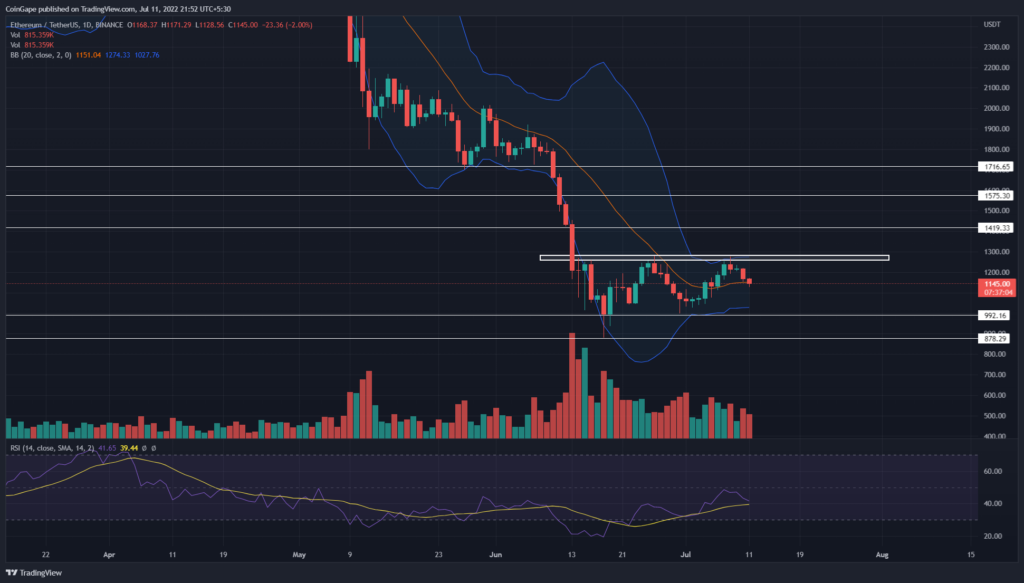
On July 8th, a long wick rejection candle at $1250 resistance indicated the sellers continue to defend the level with vigor. The resulting reversal may trigger a new bear cycle within the range-bound rally, suggesting the Ethereum(ETH) price may retest the $1000 support
advertisement
Key points:
- The ETH chart showcased a fakeout from the 20-day EMA
- The coin price may drop 13% before testing the next significant support of $1000
- The intraday trading volume in Ethereum is $13.7 Billion, indicating a 9.73% loss
Source- Tradingview
For nearly a month, the ETH/USDT pair has been wavering in a definite range, extending from $1250-to-$1000. Furthermore, the several retests to these barriers indicate aggressive buying and selling on respective ends, reflecting uncertainty among market participants.
The last reversal from $1000 support on June 30th drove the ETH price 29% up to $1250. However, another failed attempt from buyers to surpass this resistance indicates a potential reversal and continuation of the range-bound rally.
Trending Stories
Thus, the ETH price tumbled 11% in the last four days, currently trading at the $1140 mark. Moreover, if the selling pressure persists, the altcoin may slump more 13% before hitting the $1000 psychological mark.
However, the range set-up is usually a resting period before the coin price initiates its next directional rally. Thus, a bullish breakout $1250 resistance may pump the ETH price 10% higher to $1400.
Conversely, the $1000 fallout would sink the altcoin price 11% down to the June low of $896.11
Technical indicator-
Bollinger band indicator: the indicator has aligned its bands with the range barriers, providing an extra weightage to them. Thus, a breakout from either of the levels gives additional confirmation for respective market participants.
advertisement
RSI: while the ETH price action walks a lateral path, the daily-RSI slope forms new higher highs indicating growth in underlying bullish momentum. This divergence supports the bullish theory mentioned above.
- Resistance level- $1300, and $1424
- Support level- $1000 and $880


