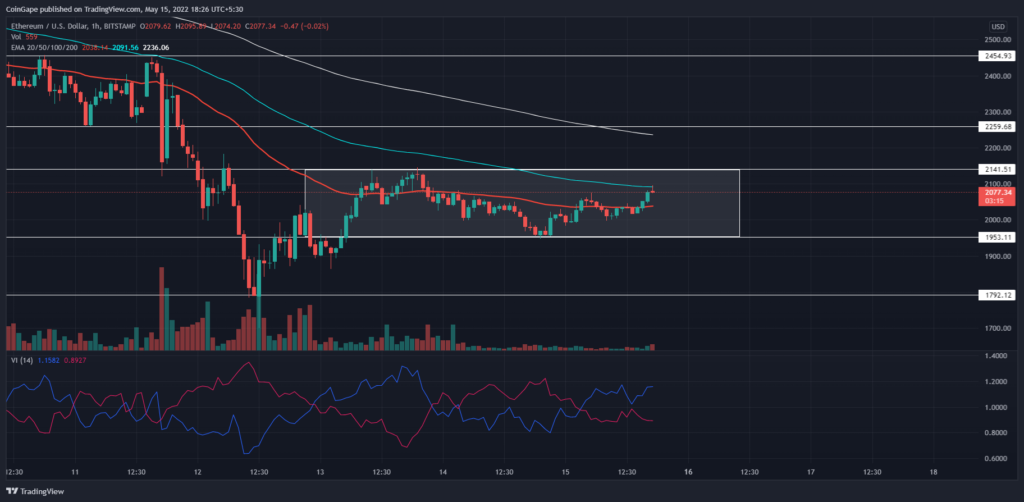
Last week the Ethereum(ETH) price witnessed a dramatic fall which plunged the altcoin below the $2165 support. As a result, the altcoin registered a 39% fall within a fortnight, and the recent fallout threatens further downfall. However, the ETH price currently stuck in a retest phase should validate if sellers are prepared for another leg down or not.
Key points:
- The ETH chart shows a potential bearish crossover of 50 and 100 DMA
- the $2165 support fallout would slump ETH price to June-July 2021 bottom support of $1800
- The intraday trading volume in the Ethereum is $27.3 Billion, indicating a 3.2% gain
Source- Tradingview
On May 11th, the Ethereum(ETH) price turned down from $2450 resistance and witnessed a steady correction to local support of $1800. Furthermore, the downfall registered a 27% discount on Ether, where its price action started to coil up.
The buyers attempted to bounce back from this support, but eventually, they submitted to the overhead selling pressure at the $2150 mark. As a result, the ETH price led into a consolidation range with the ultimate support at $1950.
Trending Stories
However, the early bullish reversal with the support of a 50-period EMA challenges the 100-period EMA.
advertisement
The bullish consolidation breakout will unleash the trapped momentum and drive the prices higher to the next resistance at $2250.
On a contrary note, the buyer surrendering under the overextended selling will trigger a minor pullback to $1950 before continuing the prevailing trend.
Technical indicator-
The 100 EMA slope near overhead resistance of $2150 would encourage sellers to revert the altcoin to bottom support. However, a rise in bullish would trigger the 100 EMA breakout and flip it to viable support.
A narrow range and several crossovers between the VI+ and VI- slope accentuate a range-bound rally. However, the current bullish alignment between these lines indicates that the buyers are now leading the charge.
- Resistance level- $2165, and $2500
- Support level- $1700 and $1400


