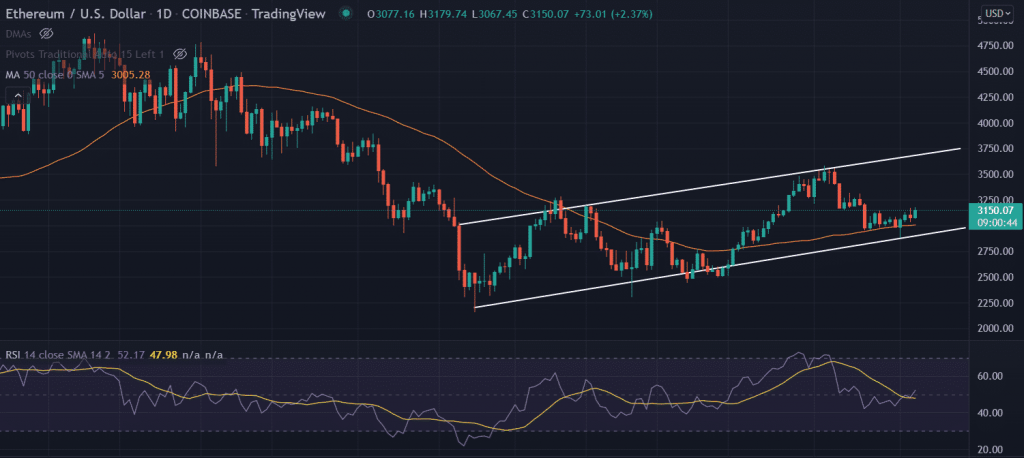
ETH price consolidates in today’s morning session, and as the trading day progressed, an upside movement is seen in the price. The price tested the highs of $3,130, which plays a strong resistance for the bulls. However, if the price breaches the mentioned level then for the short term some buying positions could be initiated. On April 18, a low of $2880 formed near the lower trend line.
- ETH price trades sideways for the last one week, after dropping by almost 20% in the last three weeks.
- The formation of ‘rising wedge’ formation on a broader time frame indicates downside movement in ETH.
- Technical setup indicates a decline if it breaks the $2,887 on the daily basis, then the next level will be $2,500.
ETH price stays above 50-day SMA
On Wednesday, after testing the upper levels at $3169, the buyers failed to maintain the gains and closed near the lower levels at $3076.77. The ETH price is taking the support from 50-days SMA (simple moving average), which pulls the asset to the upper side and holds it for the positive biasness.
If we look at the recent ETH price action, the price has been trading inside the rising wedge pattern since late January. The ‘rising wedge’ is a bearish formation. However, the price is making higher highs and higher lows as per the formation, we expect ETH price could revisit the highs of $,3800.
The Relative Strength Index (RSI) is trading between the range of 60 and 40 levels, which is not predicting any strong momentum on any of the sides.
On the contrary, if ETH accepts the lower levels of $3005 it will trigger a fresh round of selling in the asset. A bearish trend will be seen in ETH from hereon.
Trending Stories
As of publication time, ETH/USD trades at $3147.64 up 2.64% for the day.


