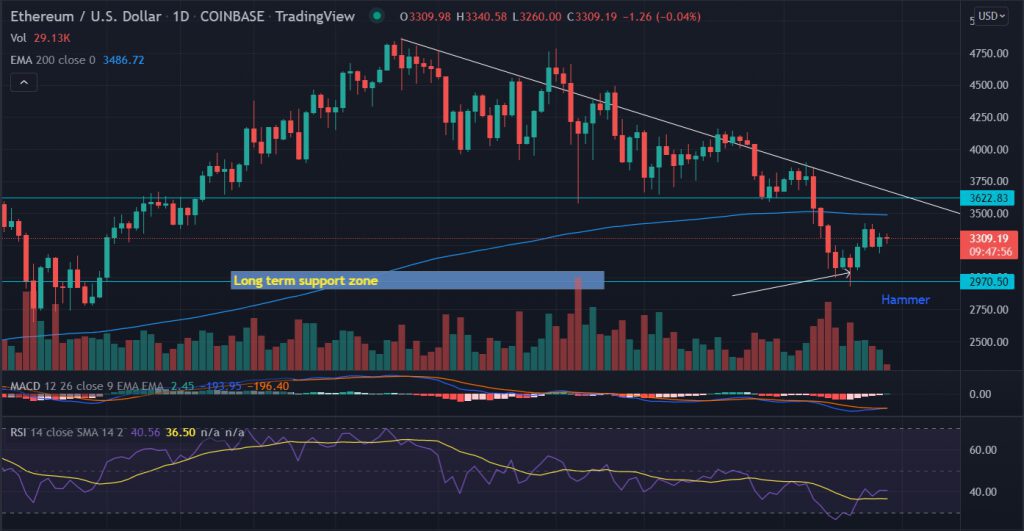
Ethereum (ETH) rises above the $3,300 mark following the previous session’s gains. After testing the highs, the world’s largest altcoin retraced lower and trades with 0.60% losses. Although, the price has recorded gains of 3.16% over the last seven days.
- ETH shows bullish interest from the long-term support zone of $2,900.
- A daily acceptance above 200-EMA is essential to chart the new bull cycle.
- USDC’s stablecoin supply on Ethereum surpassed Tether (USDT) for the first time.
Ethereum (ETH) blockchain knock down rivals USDT
Rival Tether (USDT) lagged for the first time by the total supply of the USDC stablecoin on the Ethereum blockchain. The current total supply of USDC on Ethereum is recorded at 39.92 billion, whereas it stands at 39.82 billion on USDT’s blockchain.
On the technical chart, the descending trend line from the high made on November 10 acts as a strong resistance barrier for the bulls. The lower highs and lower lows pattern dragged the price to the levels last seen in September. The intersection of the bearish slopping line and the interim resistance appears at $3,500. A break above this level will fuel the fresh upside rally in ETH with the first target placed at the horizontal resistance level around $3,800. The technical indicators remained in the oversold zone. Any uptick could see a jump in the prices.
The formation of a bullish “hammer” candlestick pattern from the lows of $2,928.69 on January 10 has resulted in four days of upside momentum. The ETH bulls enters into profit booking from the highs of $3,413.36 on January 13. However, the bears fails to exert much pressure on the price. Furthermore, an acceptance above 200-EMA (Exponential Moving Average), which stands at $3,486 is a prerequisite to keep the bullish sentiment intact.
Looking at the other side of the coin, a daily close below the January 14 low of $3,188.4 could be the reason for the bear’s joy while keeping eye on the crucial support level of $2,900.


