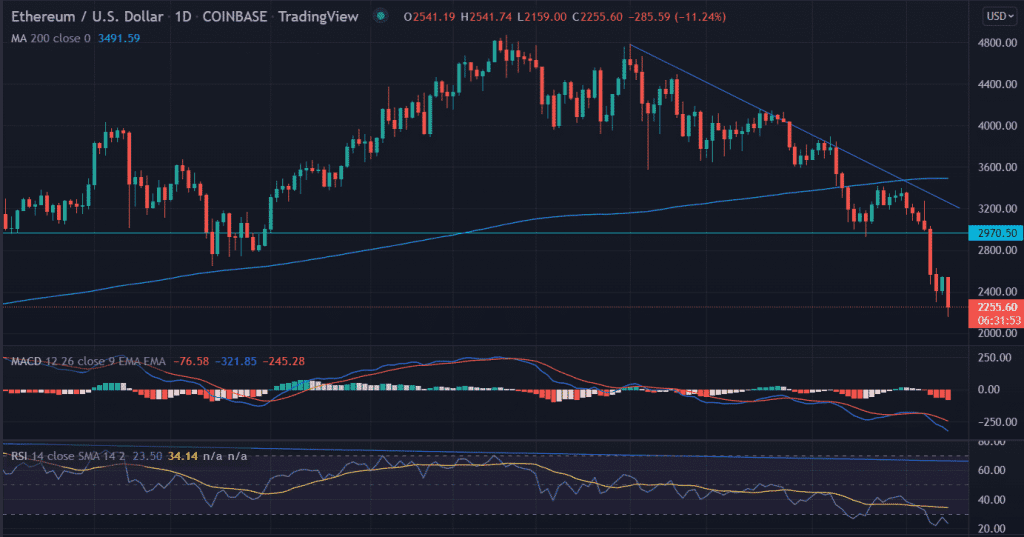
ETH/USD tumbled on Monday following the bear attack on Wall Street. NASDAQ dives 3% as the prospect of a Russian attack on Ukraine posed another threat for traders already worried by aggressive US policy tightening.
At the time of writing, ETH/USD trades at $2,225.10, down 12% on the day.
Luxor prepares to launch Ethereum mining pool
The crypto software and services company Luxor approaches to launch an Ethereum mining pool even as the cryptocurrency is currently planning to abolish mining from its network. The ETH/USD pair remained unfazed by the announcement and continue with its fall on Monday.
On the daily chart, Ethereum (ETH) price has been on the continuous falling spree from the highs of December 1 at $4,784.50 The bearish slopping line from the mentioned level acts as a strong barrier for the bulls. The buyers tested the descending trendline twice in a short time on December 27 and January 4 respectively.
ETH formed a ‘hammer’ candlestick pattern on January 10 near the lows of $2,928.69. However, the upside momentum rejected near the 200 DMA at $3,470. Once again the sellers become dominant near the inflection point. The price dropped 36% over the past eight days.
The daily Relative Strength Index (RSI) trades in the oversold trajectory coupled with the MACD (Moving Average Convergence Divergence). Both the momentum oscillators tell about the continuation of the prevailing downtrend.
On the flip side, a decisive break above the cross over the bearish slop line and the 200 DMA at $3,470 could examine the case of a bullish reversal. Furthermore, a trigger above this congestion paves the way towards the $3,665 resistance barrier in the short term.


