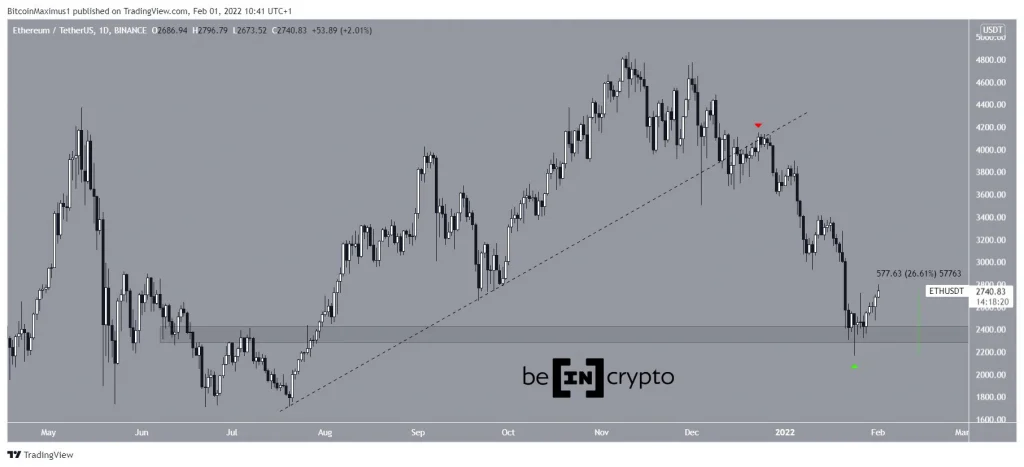
Ethereum (ETH) has been moving upwards since rebounding from support at $2,350 on Jan 24 but still has yet to confirm that a bullish trend reversal has begun.
Ethereum has been decreasing since reaching an all-time high price of $4,868 on Nov 10. The downward movement accelerated after it broke down from an ascending support line and validated it as resistance immediately after (red icon).
The downward move led to a local low of $2,159 on Jan 24. The sweep of the lows and ensuing bounce validated the $2,350 horizontal area as support.
ETH has been moving upwards since testing support (green icon) and has so far increased by 27%.
Indicator readings
Technical indicators on the daily chart are showing bullish signals. This is especially evident in the daily RSI, which has reached a high of 43 after briefly dropping below 30.
The RSI is a momentum indicator and readings below 30 are considered oversold. The previous time the RSI dropped below this level and reclaimed it was at the March 2020 bottom (red circle).
If the upward movement continues, the closest resistance area would be found at $3,200. This is the 0.382 Fib retracement support level.
The six-hour chart shows that ETH is following an ascending support line and has broken out from the $2,615 horizontal resistance area.
However, it has been rejected by the 0.5 Fib retracement resistance level at $2,785 and created a long upper wick (red icon). This is considered a sign of selling pressure.
If ETH were to break down from the ascending support line and horizontal support area, it would indicate that the bottom is not yet in.
ETH wave count
Cryptocurrency trader @Tradinghubb tweeted an ETH chart, stating that another downward move is likely in order to complete the entire correction.
The movement since the May 2021 high appears to take the form of an A-B-C corrective structure. In it, waves A and C have an exact 1:1 ratio, which is common in such corrections. Furthermore, the entire movement has been contained inside an ascending parallel channel, supporting the possibility that the low is in.
However, the short-term count suggests that ETH has yet to complete five full waves down, thus supporting the possibility that another low will eventually follow.
However, even in this case, ETH would likely still increase towards $3,150 before falling once again.
Finally, a look at the two-hour chart shows that the upward move following the Jan 24 bottom is a three-wave structure.
This supports the possibility that ETH has yet to reach its low and will rather decrease once more after reaching the previously outlined resistance.
For BeInCrypto’s latest Bitcoin (BTC) analysis, click here
Disclaimer
All the information contained on our website is published in good faith and for general information purposes only. Any action the reader takes upon the information found on our website is strictly at their own risk.


