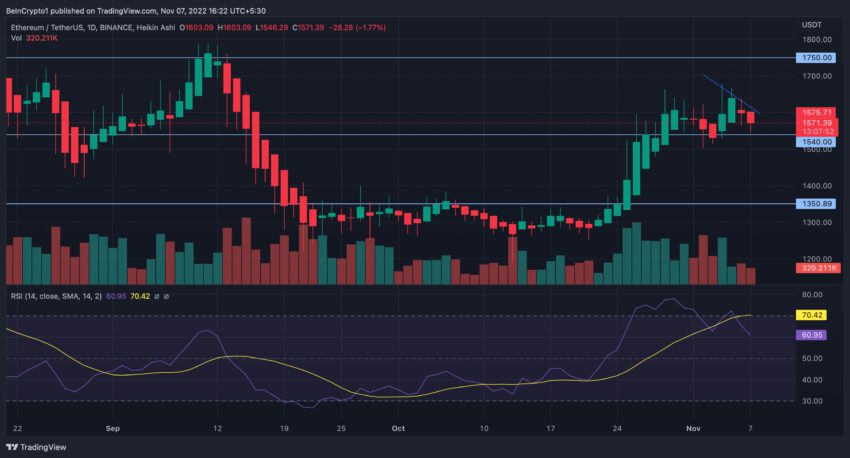
Ethereum (ETH) price, after charting a multi-week high of $1,680, has started its downward journey. Are bears set to take over and push price action to the lower support level?
Ethereum price saw a considerable jump over the last few days after Ethereum co-founder Vitalik Buterin revealed Ethereum’s updated technical roadmap. Buterin added a new stage to the roadmap, aiming to improve censorship resistance and decentralization of the Ethereum network.
Plans of shielding the Ethereum network from censorship were accompanied by a 6% price increase on Friday. However, at press time, ETH price traded at $1,575 presenting a 2.65% drop over the last day.
Ethereum Price Action Weakens
Ethereum bulls did a solid job over the weekend of pushing ETH price to the upper $1,680 level. Even though price charted quite a run, the $1,680-$1,700 price barrier cut short the coin’s price trajectory.
ETH price made lower highs while daily RSI saw a sharp reversal before entering the overbought zone. While daily RSI still presented a higher concentration of buyers than sellers, with bearishness creeping in, sellers could take control driving prices lower.
One of the reasons behind ETH weakening price momentum was the dwindling number of active addresses. Data from Glassnode showed that Ethereum number of active addresses (7d MA) reached a four-month low of 27,303.357 on Nov. 7.
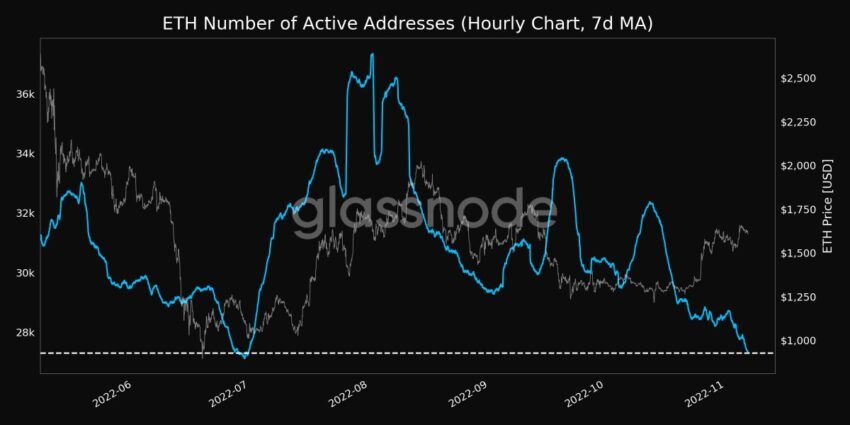
Declining active addresses presented a waning market confidence from participants. Ethereum addresses saw a decline of almost 14.8% over the last week, to 622K, which was a bearish trend as price momentum weakened.
Furthermore, Ethereum’s number of transactions (7d MA) also hit a 4-month low. One reason for this could be ETH’s relatively higher transaction fee.
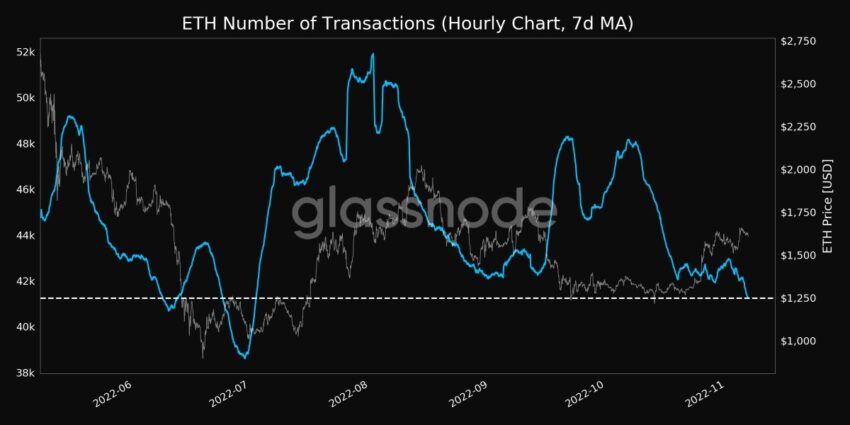
Over the past week, ETH weekly transaction fees were 19.4% higher than average. With price action weakening, what can be expected from ETH?
Open Interest Takes a Dip
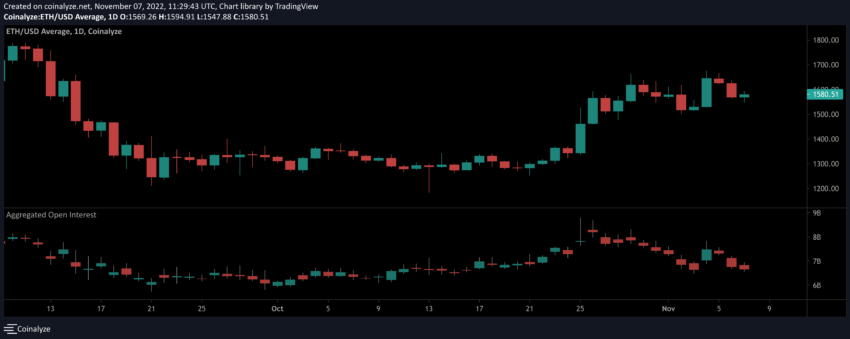
Data from Coinalyze suggested that Open Interest over the last day saw an 8.81% fall. A drop in the total open interest alongside falling prices could likely point towards disgruntled long position holders being forced to liquidate their positions.
Price DAA divergence shows a major bearish divergence and had been trending low for quite some time. In June this year, when ETH chart noted a similar DAA divergence, Ethereum price dropped by almost 30%.
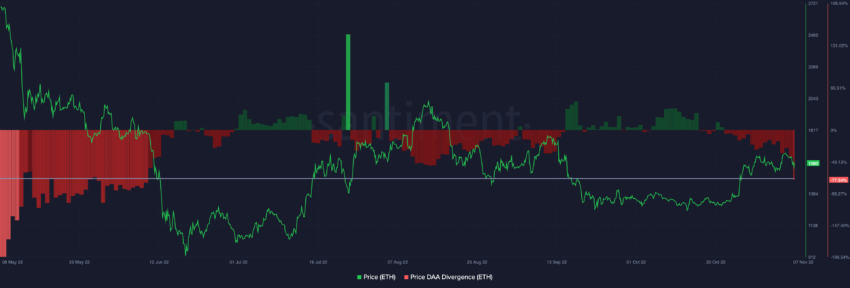
ETH price DAA divergence hasn’t witnessed a fall to this level since June.
However, accumulation from whales holding 1,000+ coins continued to take place in the market. Notably, Ethereum’s number of addresses holding over 1,000 coins reached a one-month high of 6,331.
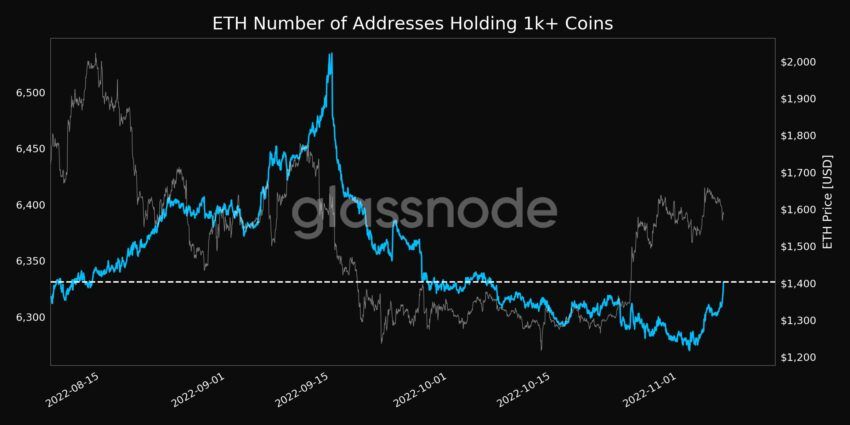
For Ethereum price going forward, would accumulation be enough to keep price action going?
IntoTheBlock’s In/Out of Money Around Price Indicator suggested that a significant barrier lies for ETH price at the $1,588 level where 1.56 million ETH is held by 4 million addresses.
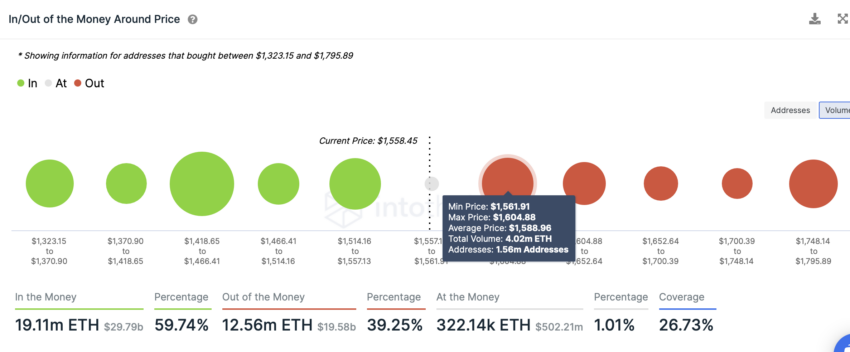
However, since bearish indicators were more dominant the $1445 level could act as a strong support where 7.22 million ETH is held by 4,7250 addresses.
Ethereum price action seemed at a crucial crossroads at press time a bearish pull could bring ETH price down to $1,400, but invalidation of the bearish thesis can place prices above the $1588 level.
Disclaimer: BeinCrypto strives to provide accurate and up-to-date information, but it will not be responsible for any missing facts or inaccurate information. You comply and understand that you should use any of this information at your own risk. Cryptocurrencies are highly volatile financial assets, so research and make your own financial decisions.
Disclaimer
All the information contained on our website is published in good faith and for general information purposes only. Any action the reader takes upon the information found on our website is strictly at their own risk.

