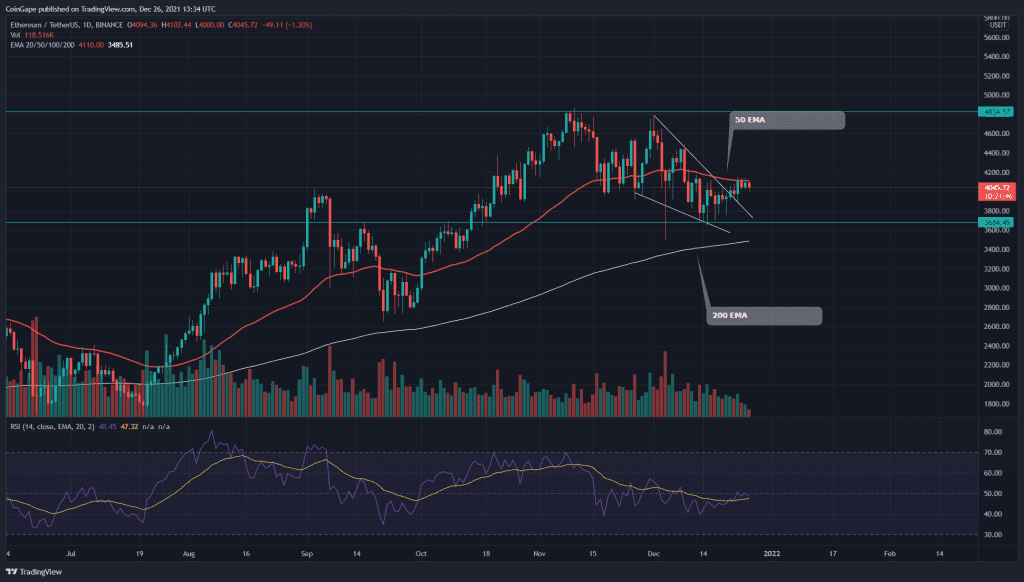
The Ethereum price action still indicates a correction phase in its chart. However, sustaining above the $3700 support, the coin has revealed a bullish price pattern, which can initiate a new rally in this pair once it breaks out from the crucial resistance zone around $4100.
Ethereum Key technical points:
- The ETH coin is facing strong resistance from the 50-day EMA
- The intraday trading volume in the ETH coin is $12.1 Billion, indicating a 3% gain.
Source- Tradingview
The last time when we covered an article on Ethereum on December 16th, the coin price was wobbling in a falling wedge pattern. This pair was rejected from the descending trendline, resulting in another dip in the price. However, the sellers can never sustain the price below the $3700 support.
On December 21st, the coin price managed to breach the overhead trendline, trying to end this correction phase. The price also reclaimed the $4000 mark and is currently retesting this level for proper support.
The ETH coin will maintain an uptrend so long as it trades above the trend-defining 200 EMA. However, the 50 EMA line is providing strong resistance to the price.
The daily Relative Strength Index (48) approaching the neutral line(50) has started showing recovery signs in its chart. Moreover, the RSI line has crossed above its 20 EMA.
ETH/USD 4-hour time frame chart
Source- Tradingview
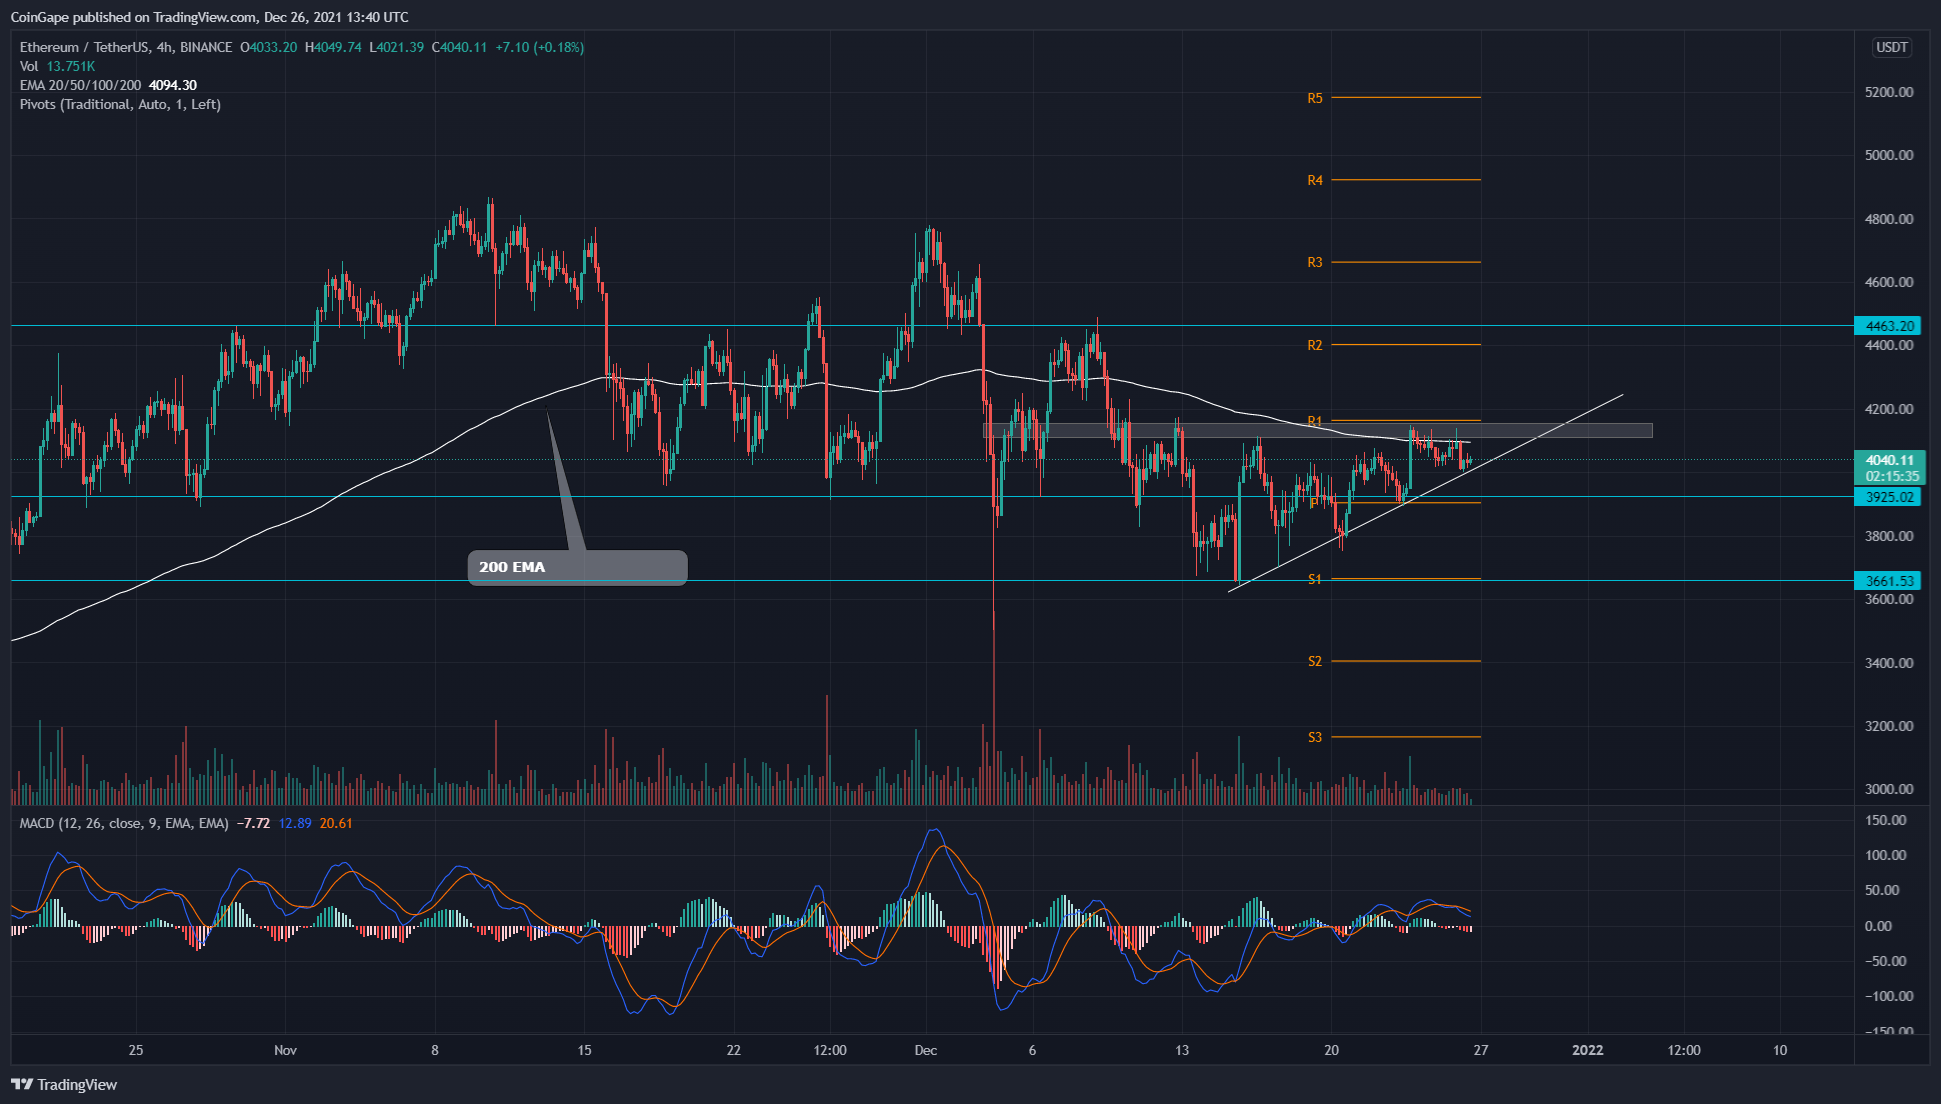
The ETH coin price resonates in an ascending triangle pattern in the 4-hour time frame chart. This pattern has its neckline at $4150-4100, which is the key resistance the buyers need to knock out for initiating an upward rally.
On the contrary, the crypto traders should wait till the price breaks free from the overhead resistance before entering a long trade, as a possible breakdown from the support trendline could drop the price back to the $3700 mark.
The traditional pivot suggests the nearest resistance level for ETH price is $4164 and $440 to play a significant role. Furthermore, the support levels are around the $3900 mark and $3666 level.


