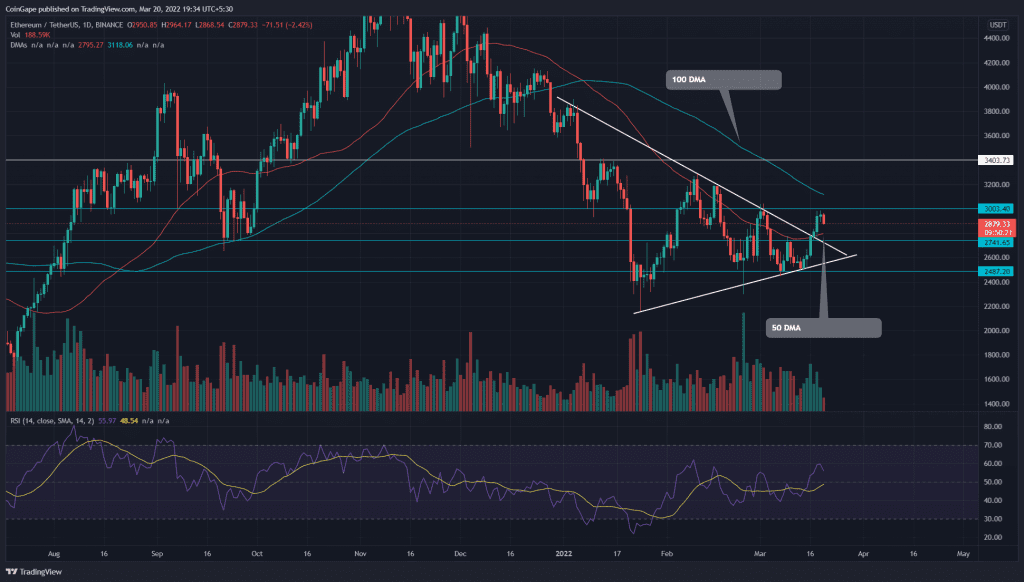
After a two-month consolidation, the (Ethereum)ETH traders escaped the symmetrical triangle pattern with a bullish breakout. Outperforming the largest cryptocurrency, Bitcoin, the ETH/USDT pair has rallied 16.5% this week. However, the buyers need to pass through a retest phase before they expect any follow-up rally.
Key points:
- The ETH chart shows an evening star pattern at $3000 resistance.
- The ETH price surpasses the 50 DMA
- The intraday trading volume in Ether is $12.3 Billion, indicating a 16.48% loss.
Source- Tradingview
The six consecutive green candles from the $2500 local support drove the Ether price to the $3000 mark. On March 17th, the bullish rally breached the resistance trendline of the continuation pattern, signaling a further recovery in price.
However, the altcoin forming a bearish evening star candle at $3000 resistance suggests the sellers continue to defend this level. However, the follow-up reversal would retest the breached resistance($2750) to confirm an honest breakout,
If buyers sustain above the $2750 level, the potential rally could pierce the $3000 resistance and hit the $3400 mark.
Contrary to the bullish thesis, if sellers slip the altcoin below the descending trendline, the range-bound rally would likely continue for a few more sessions.
Currently, the ETH price trades at $2852, indicating an intraday loss of 3.33%
Technical Indicator
The daily-Relative Strength Index indicator surpassed its previous swing high resistance(55%) and rallied to the 60% mark. The RSI slope holds above the equilibrium during the retest phase maintains a bullish bias.
The 50 DMA line will assist buyers to sustain above the $2750 mark. However, the overall trend remains bearish as ETH price trade below the 100 and 200 DMA.
- Resistance levels- $3000, and $3400
- Support levels are- $2741 and $2500


