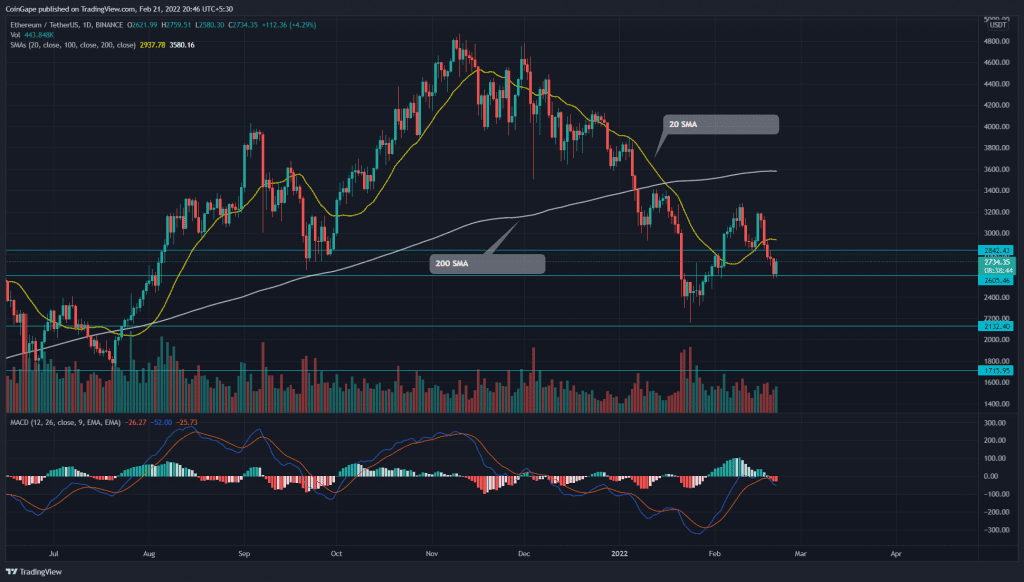
The Ethereum (ETH) price has already lost 50% of its gains obtained during the recent recovery rally. The coin chart showed five consecutive red days, which plunged the coin price to $2600. This minor support stands as the last line of defense preventing sellers from pulling the coin to January’s low support at $2200, will bear domination continue or bulls step in at the last minute.
Key technical points:
- The ETH chart shows a bearish crossover of the 100-and-200 SMA
- The intraday trading volume in ETH/USD is $15.2 Billion, indicating a 39.5% hike.
Source- Tradingview
Amid the ongoing sell-off in the crypto market, the ETH price reverted from the $3200 psychological level which registered an 18% loss in the last five days. The coin chart displayed a bearish double bottom pattern bolstered the supply pressure as sellers pulled the below $2840 neckline.
Following this breakdown, the altcoin plunged to the immediate support of $2600. By the press time, the ETH price is trading $2728 mark, indicating a 4% gain from the mentioned support.
However, the 100-and-200-day SMA negative crossover would encourage the traders to follow a bearish path. Moreover, the chart also shows a bearish sequence among the crucial SMAs(20, 50, 100, and 200)
After a bearish crossover, the MACD indicator’s lines slip below the neutral zone, indicating an increasing selling momentum.
ETH Risks Further 16% Downside If Buyers Lose This Key Support

Source-Tradingview
The ETH/USDT pair rebounds from the $2600 support accompanied by a significant surge in volume activity. If the buying pressure sustains, the altcoin would retest the $2830 mark, followed by the $3250 resistance.
On a contrary note, if sellers plunge the coin below the $2600 mark, the ETH price would retest the January low support($2200) along with the threat for downtrend resumption.
Resistance levels- $2830, $3250
Support levels are- $2600 and $2200


