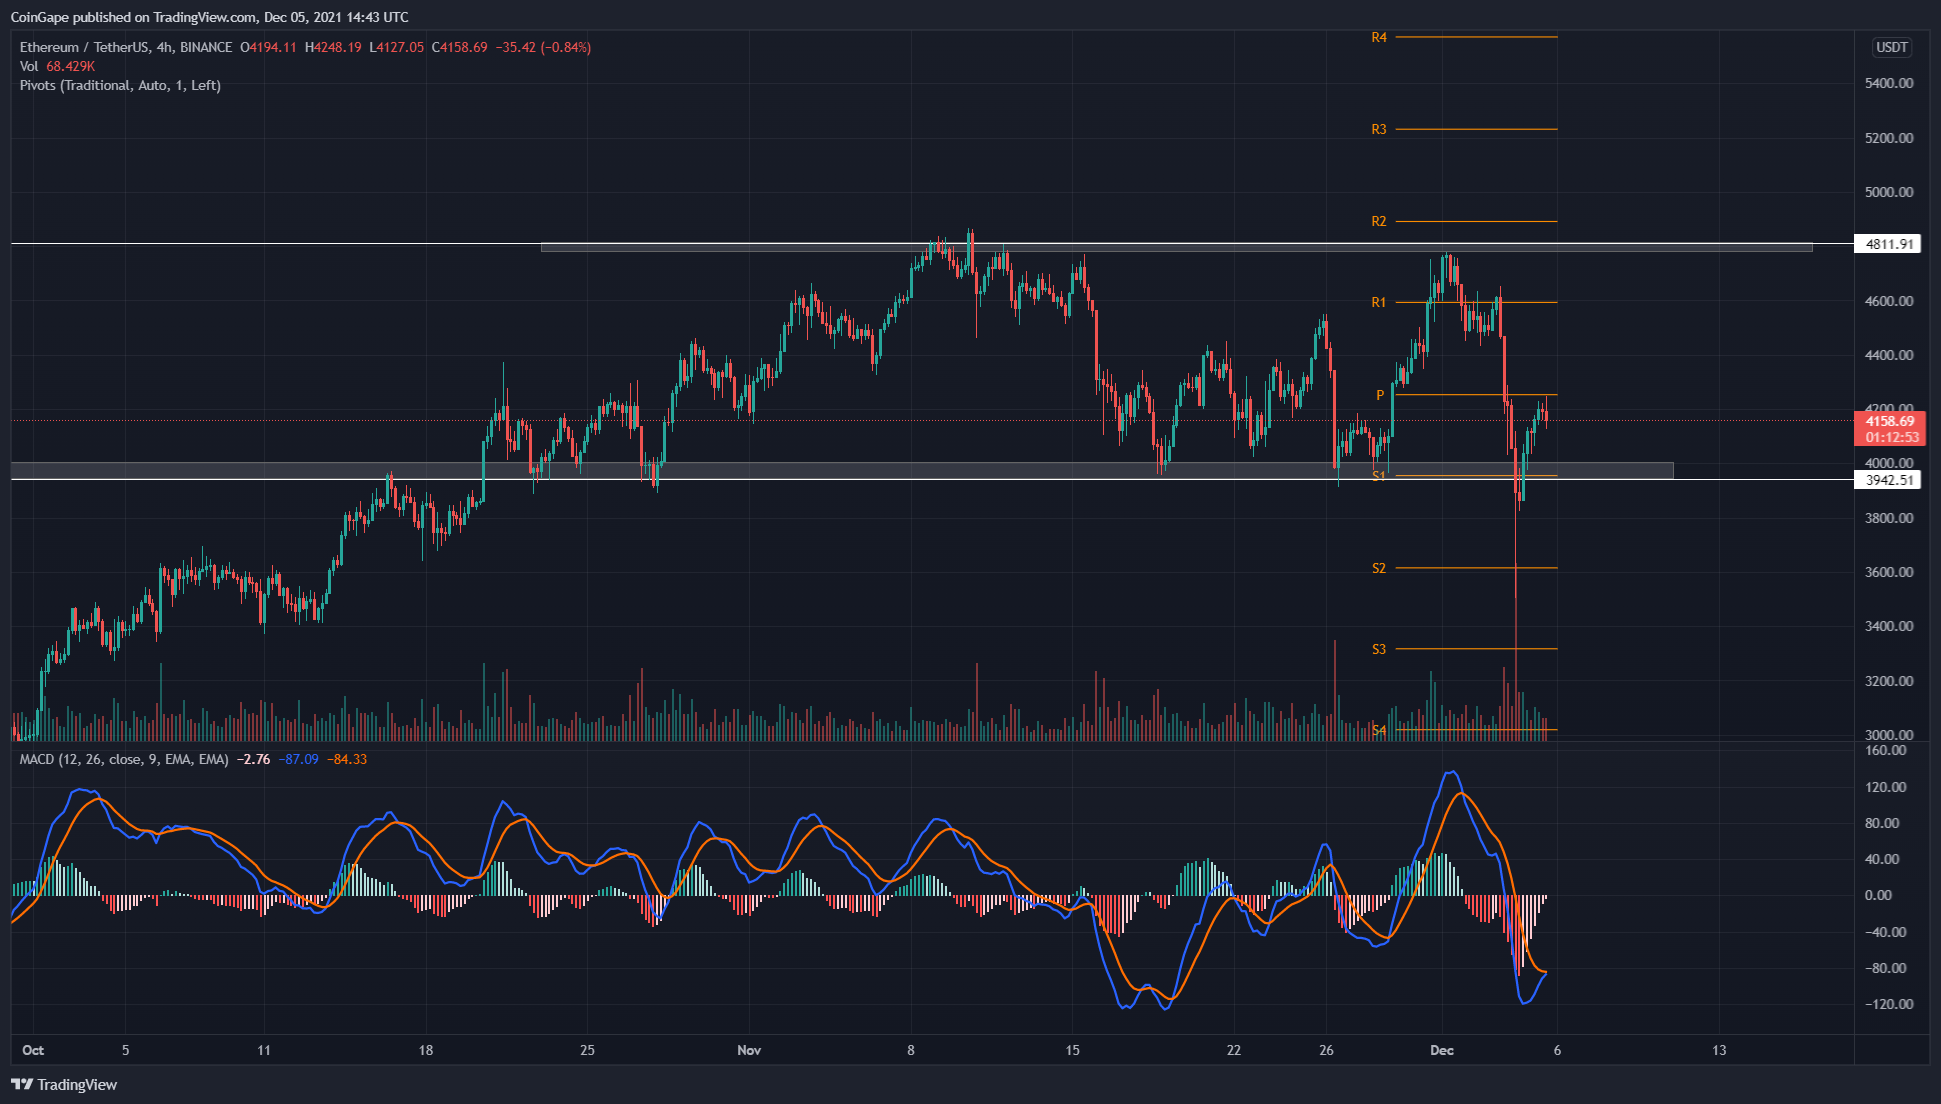
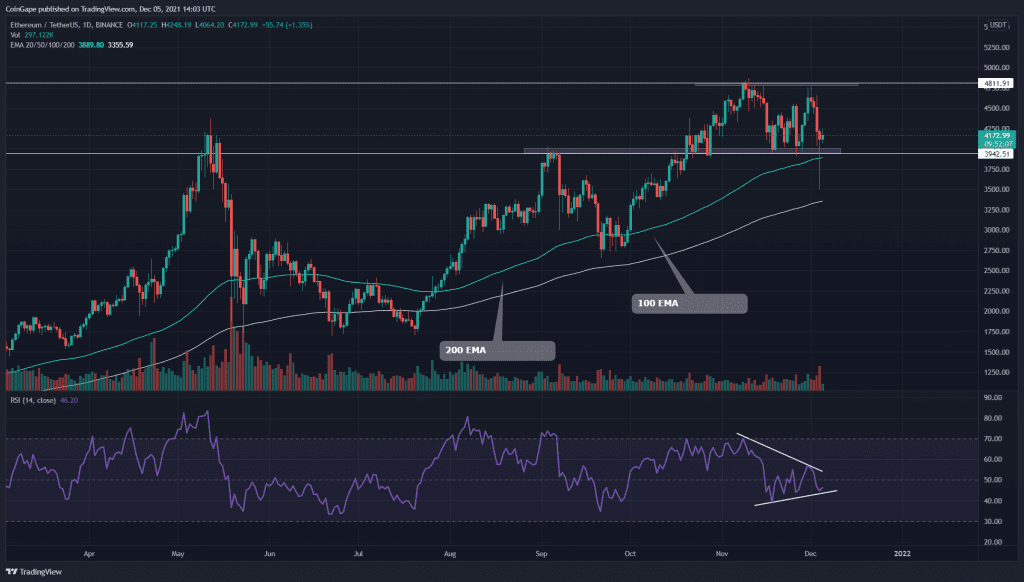
After the second rejection from the All-Time High resistance of $4811, the ETH coin entered another retracement phase in this chart. The coin price lost 15% in those four days and dropped to $4000 support. However, unlike some other cryptocurrencies, the ETH coin indicated an impressive recovery from the blood bath of December 4th.
Key technical points:
- The ETH price could enter a consolidation phase
- The daily RSI chart shows a bullish divergence concerning ETH price action
- The intraday trading volume in the ETH coin is $27.8 Billion, indicating a 33.8% loss.
Source- ETH/USD chart by Tradingview
As mentioned in my previous article on ETH/USD, the coin displayed an impressive recovery in its chart where the price rallied back to the All-Time High resistance of $4850. However, after experiencing strong rejection from this level, the coin initiated another retracement phase, which plunged to the crucial support of $4000.
Moreover, the sudden selling pressure on December 4th breached this support level too, but by the end of the day, the buyers recovered most of the losses, giving a daily candle closing above the $4000 mark.
The Relative Strength Index(45) displayed a bearish divergence in its chart due to the sudden selling of this coin. However, the underlining momentum is still bullish as the RSI line shows steady growth in its value with a bullish divergence at the bottom line.
ETH/USD 4-hour Time Frame Chart

Source- ETH/USD chart by Tradingview
The ETH coin has been resonating between the $4820 and 3950 mark for more than a month now, indicating a range bound movement in its chart. Therefore, until the price consolidates in this range, the crypto traders can maintain a bullish sentiment for this coin.
Moreover, the coin will provide an excellent trading opportunity when the price breaches the border levels of this range.


