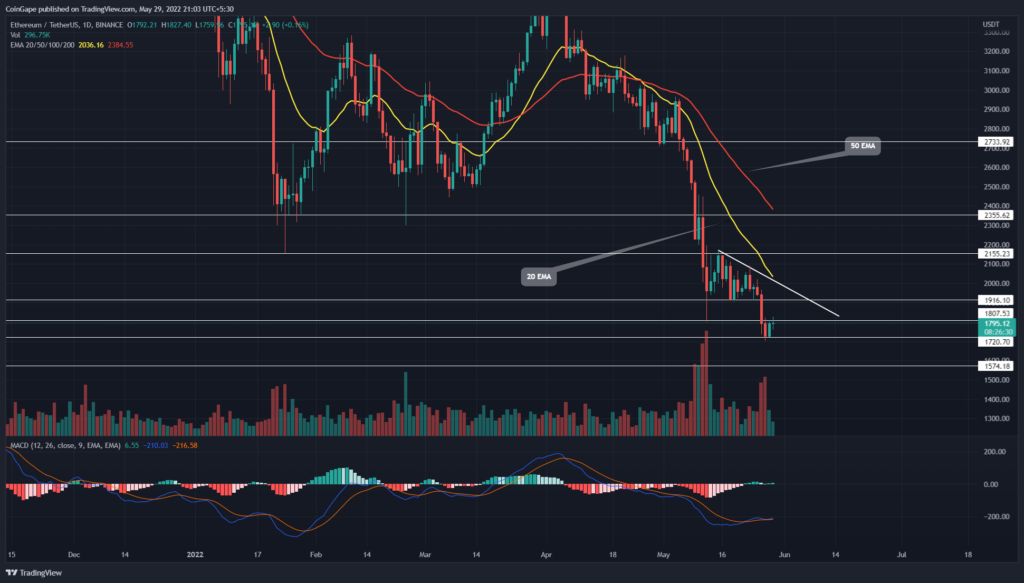
While the Bitcoin price witnessed a minor consolidation, the Ethereum(ETH) price lost more ground this week and tumbled to yearly support of $1721. However, the altcoin is bullish on the weekend and may retest the breached $1900 support to validate further downfall.
Key points:
- The ETH chart shows a straight-eight red candle on the weekly time frame chart
- The $1700 support fallout would slump ETH price to $1600 support
- The intraday trading volume in the Ethereum is $11.4 Billion, indicating a 26.3% loss
Source- Tradingview
The Ethereum(ETH) price has experienced a consistent downfall for the past eight weeks, showcased by the eight red candles on the weekly chart. On May 9th, the altcoin lost the last quarter button support of $2300, suggesting a resumption of the prevailing downtrend.
The post-retest rally tumbled the ETH price by 18.5%, which took a breather at $1900 support. For nearly two weeks, this support stalled the ongoing downtrend teasing a potential pullback. However, the increasing selling pressure pulled the altcoin below the $1900 mark on May 26th.
After establishing a new lower low of $1721, the ETH price reverted 5% to retest the potential resistance levels ahead, such as $1800, $1900, and a descending trendline.
Trending Stories
A bearish reversal from these resistances could potentially breach the $1800 support and hit the next significant support at the $1600 mark.
advertisement
Technical indicator-
Despite a falling price action, the MACD indicator rises with a bullish crossover between the signal and the MACD line. This buy signal may bolster the bullish pullback to the overhead trendline.
The enlarged gap between the ETH price and the fast-moving 200-day EMA suggested aggressive selling in the market. However, an expected bullish pullback in price may face ample supply pressure at aligned resistance of 20 EMA and descending trendline.
- Resistance level- $1800, and $1800
- Support level- $1700 and $1600


