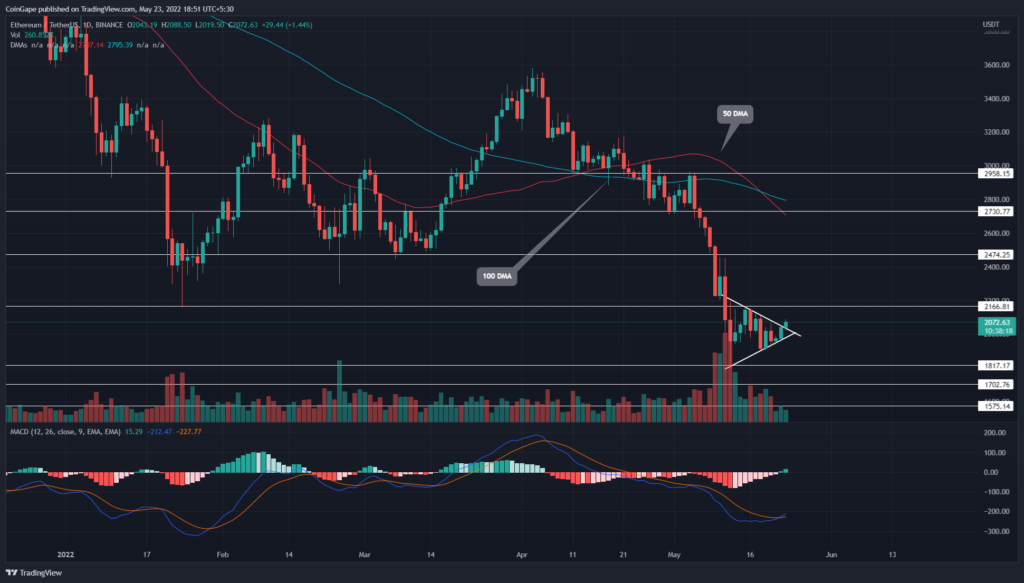
The Ethereum(ETH) price saw a sharp fall from $2965.85 right down to $1800 during the first week of May. As a result, the ETH coin marked a 38% drop across multiple support levels in a weeks span. Furthermore, the coin price has been consolidating in a symmetrical triangle pattern threatening another fallout or a possible recovery rally.
Key points:
- The MACD indicator’s bullish crossover projects a buy signal
- A 44% fall in the ETH price since its April high of $3580.34
- The intraday trading volume in the Ethereum is $12.7 Billion, indicating a 30% hike
Source-Tradingview
In April, the Ethereum(ETH) price experienced a V-top reversal from the $3573 and plunged to $2730. However, the May month worsened the situation for coin holders as the crypto market suffered a strong sell-off.
On may 6th, the ETH price breached the $2730 support and the accelerated selling momentum continued the downfall below the $2000 support. Howereve, despite a widespread negative sentiment, the sellers are struggling to sustain below the $2000 mark.
This uncertainty among market participants led to a symmetrical triangle formation. Today, the ETH price is up by 1.34% and triggers a bullish breakout from this triangle.
Trending Stories
With the expected retest to provide a right entry opportunity, the Ether price should rally 20% high to $2500.
advertisement
On a contrary note, if sellers pull the altcoin below the flipped support trendline, the resulting fakeout may slumped the altcoin below $2000.
Technical indicator-
A bullish crossover of the MACD and signal line may encourage new buyers in the market.
The Ether price undermined a recent sell signal from 50 and 100 DMA bearish crossover, indicating the buyers are defending the lower level. However, the potential bull rally could face supply pressure at 20 DMA near $2200 resistance
- Resistance level- $2200, and $2500
- Support level- $1800 and $1700


