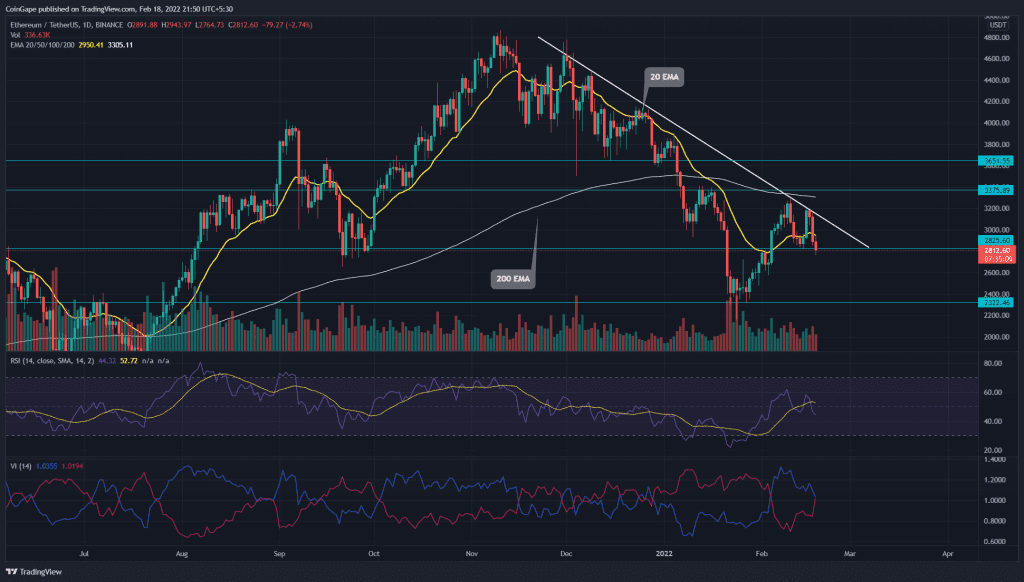
The recent reversal from the descending triangle in the Ethereum (ETH) price shares the same fate as most altcoins due to the fall in Bitcoin prices. Last night, the ETH price fell more 7.15% as the bears overtook the trend control within hours. Moreover, the downfall creates a double top pattern with the neckline at the $2,800 support zone. Will the bears smash below the $2800 support zone?
Key technical points:
- The ETH prices crack beneath the 20-day EMA
- The Vortex indicator shows a trend reversal crossover
- The intraday trading volume in ETH/USD is $14.74 Billion, indicating a 5% fall.
Source- Tradingview
As the bearish clouds cover the crypto market, the Ethereum (ETH) price fell 7.15%, resulting in an evening star pattern. This creates a reversal trend from the descending trendline and a double top pattern with the neckline at the $2800 support zone.
The Ether prices failed to surpass the trendline after giving a fake out of the $2,800 support zone and creating a low of $2400. Hence, the recent downfall may soon retest the low of $2,400 with the double top breakout.
Ethereum (ETH) price trades below the 20 and 200 EMA, as the lines maintain a bearish alignment. The daily-Relative Strength index (44) slope reflects a bearish divergence in the last two dips.
Trendline Breakout Unleashes The Trapped Bears

Source-Tradingview
The rising selling pressure drives the Ethereum prices below the highly influential support trendline in the 4-hour ETH/USD chart. Moreover, the recent 4-hour candle pierces into the support zone with a 2.33% fall.
Contrary to the bearish analysis, if by any chance bulls survive the downfall, a reversal can find resistance near the $3000 and $3400 mark, above the resistance trendline.
The moving average convergence/divergence indicator shows the MACD and signal line giving a parabolic fall below the zero line. Moreover, the rising trend of the bearish histograms represents the increased selling pressure.
- Resistance levels- $3000, $3400
- Support levels are- $2650 and $2400


